


1000 FRIENDS OF WISCONSIN
Background
Wisconsin is undergoing a marked shift in how people in the state are choosing to travel. Data show that the number of miles driven in the state has fallen, or has levelled off in the last ten years. This is in sharp contrast to previous decades, when people drove more each year, since the creation of the Interstate System in the 1960’s.
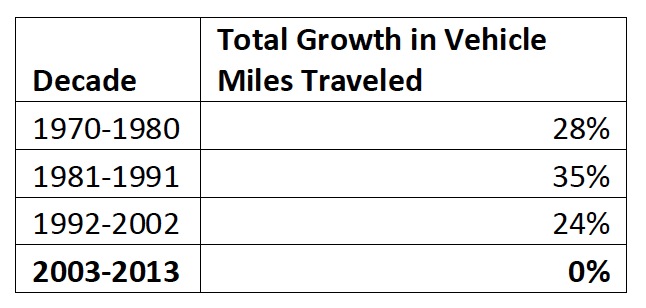 Each decade since the 70’s saw an average yearly increase of 2 to 3 percent in vehicle miles traveled (VMT) – with VMT going from 25,795 million 1970, to a peak of 60,398 million in 2004.1 However, since then the number of miles driven both in total and per-capita in the state has tumbled – with the latest decade registering no growth at all. Wisconsin drove fewer total miles in 2013 than we did in 2003.1 The drop in VMT per capita is even greater – the average Wisconsinite drives 500 fewer miles today than he or she did in 2004.
If earlier trends had continued, Wisconsinites would currently drive an average of 11,300 miles annually instead of the current average of 9,400. If from 2003-2013 the state had continued to increase the number of miles driven at the rate it had previously we would have driven 16 billion more miles than we did in 2013. Relative to the previous trend, there has been a 27% decline in miles driven over the last decade.
Several studies, surveys and reports provide compelling evidence that we are unlikely to return to the former rates of growth. These changes are unprecedented and important to incorporate into land-use and transportation planning. It is imperative that Wisconsin Department of Transportation (WISDOT) closely monitors and analyzes these trends in order to make careful and informed planning decisions.
However, the agency appears to be using outdated data to make traffic projections and continues to advocate for increased highway capacity as a way forward for Wisconsin’s transportation system.
…
Conclusions
Our analysis indicated that in every single case, WISDOT based the need and purpose of the highway expansion project on projected trends that were much higher than that of the last decade. The average difference in projected trends, after removing outliers was 73%. In most cases WISDOT projected annual growth rates of over 2%, while most corridors in the study saw either negative or no growth.
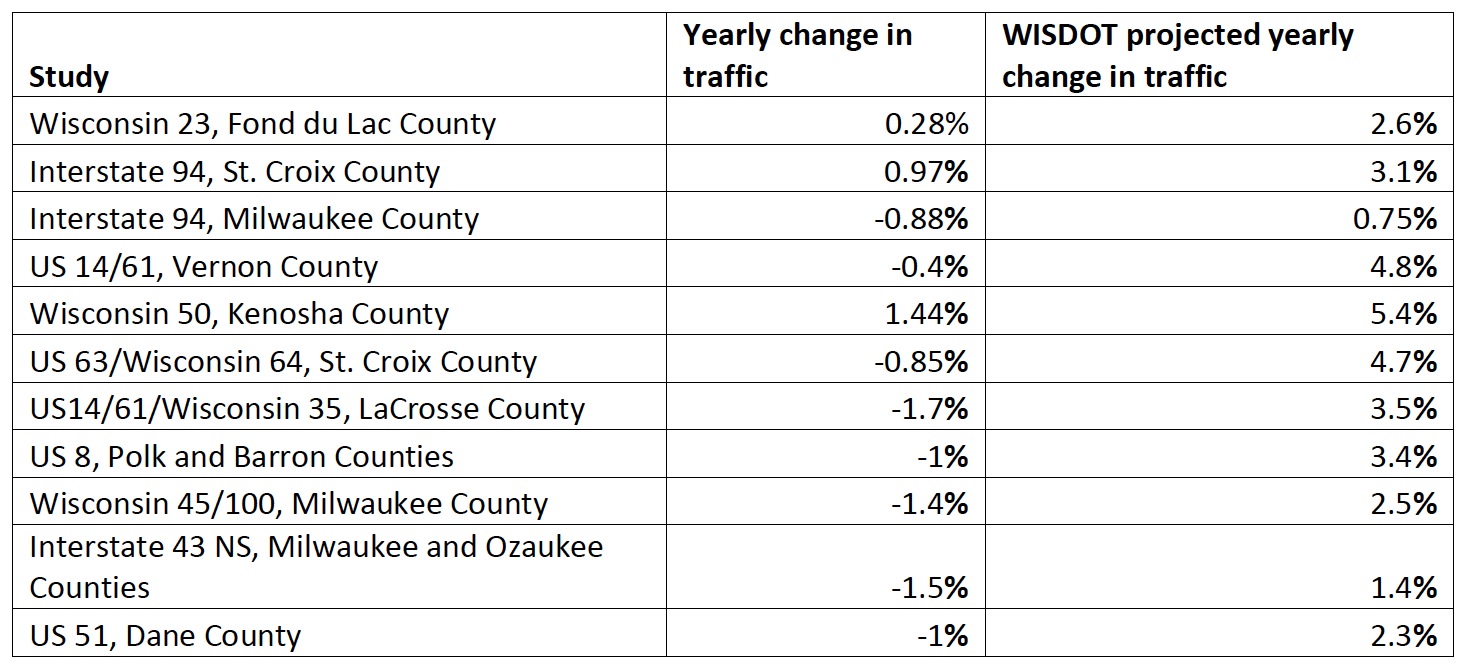
We found that, after removing for outliers, WISDOT projected an average growth rate of 2.96% annually, while in reality, traffic declined, on average 0.55% annually. In the case of Wisconsin 241 in Milwaukee, WISDOT projects a bizarre 12% annual rate of growth – leading to a 1328% difference in projected trends.
On average, after removing for outliers, WISDOT predicted that by 2040, or the closest design year there would be an average of 63% growth in traffic.
It also appears that in many cases highway capacity expansion is added to projects making them far more expensive, when reconstruction or rehabilitation would have sufficed.
The findings of the study point to flaws in WISDOT methodology and raises questions about how the state is choosing to spend its scarce transportation resources. Continuing to expand highways that are likely to be underused at the expense of other transportation modes will leave the state with an inadequate transportation system that does not serve the needs of all users.
Download full version (PDF): WISDOT Projections vs Reality
About 1000 Friends of Wisconsin
www.1kfriends.org
1000 Friends of Wisconsin advocates and promotes uses of land, water and air that shape healthy communities where people want to live, work, and play.
Our work focuses on helping communities make the connection between our everyday land use and transportation decisions and our state’s economic, environmental and cultural health.
Tags: 1000 Friends of Wisconsin, WI, Wisconsin, Wisconsin Department of Transportation
 RSS Feed