Support for InfrastructureUSA.org
has been provided by these organizations and individuals:

John Hennessy III,
P.E.

Posts Tagged ‘Natural Gas’

Boston: Methane Emissions from Natural Gas Infrastructure

Thursday, January 29th, 2015
methane fig1

PROCEEDINGS OF THE NATIONAL ACADEMY OF SCIENCES OF THE UNITED STATES OF AMERICA (PNAS)
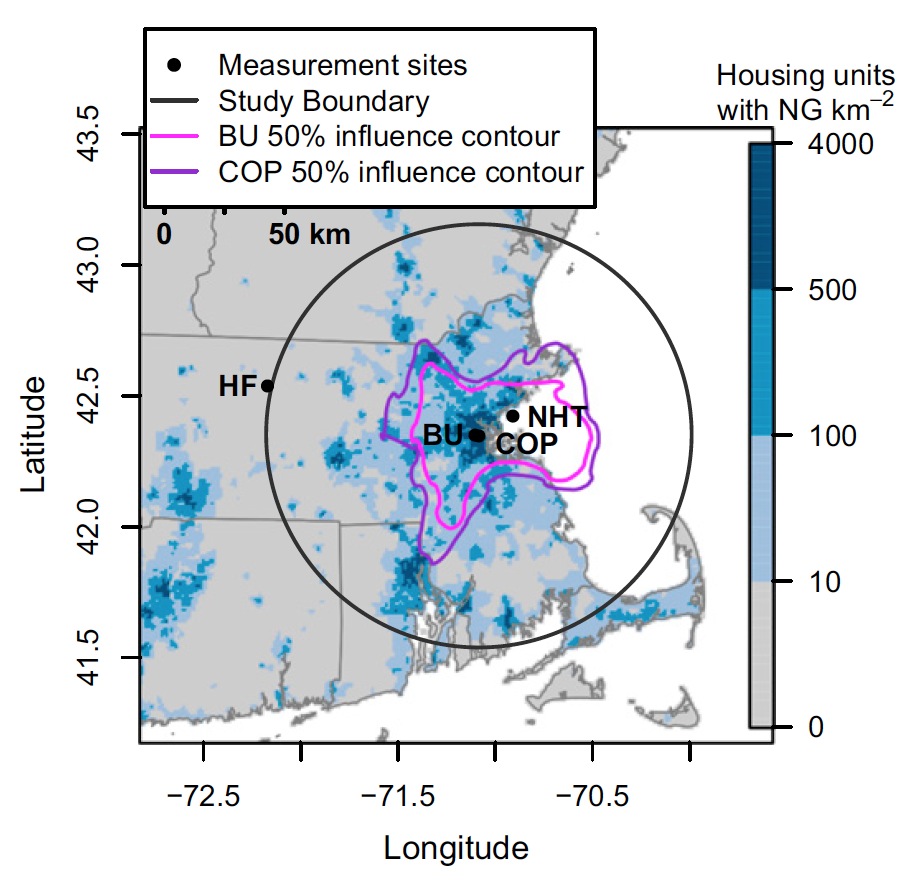
Most recent analyses of the environmental impact of natural gas have focused on production, with very sparse information on emissions from distribution and end use. This study quantifies the full seasonal cycle of methane emissions and the fractional contribution of natural gas for the urbanized region centered on Boston. Emissions from natural gas are found to be two to three times larger than predicted by existing inventory methodologies and industry reports. Our findings suggest that natural-gas–consuming regions may be larger sources of methane to the atmosphere than is currently estimated and represent areas of significant resource loss.

View this complete post...

Our Energy Tomorrow: The State of American Energy

Friday, January 9th, 2015
hydropower

America now occupies a position of energy leadership that was unthinkable a short time ago. Gone are the days of uncertainty and concern over having the supply of energy we need, when we need it. Today, the United States is the world’s top producer of natural gas, the world’s leading refiner of petroleum products, and very soon could be the leading producer of oil…But this is only part of America’s larger energy story. The United States is in the midst of a new era in domestic energy abundance characterized by rising use of renewable energy and increased oil and natural gas production that is strengthening our economic outlook and enabling America to emerge as a global energy superpower.

View this complete post...

Interactive Map: Climate and Energy by State

Thursday, October 9th, 2014
Electricity Generation from Renewable Energy

Curious how your state stacks up when it comes to sustainability, renewable energy or climate-friendly policies? The Georgetown Climate Center’s new interactive map includes all these parameters (and much more) in its colorful, easy-to-read interface. With the center’s proprietary State Energy Analysis Tool as the engine, this map offers insight into a wide range of data that’s otherwise hard to come by, from Electricity Market Regulation to Energy Exporters and Importers. State profiles offer an in-depth analysis of each state’s energy/climate breakdown.

View this complete post...

The Economic and Climate Change Benefits of Accelerating Repair and Replacement of America’s Natural Gas Distribution Pipelines

Monday, July 28th, 2014
Figure 1: Historical U.S. Employment, Thousands of Jobs

BLUEGREEN ALLIANCE
As the United States continues a slow but steady recovery from the recession triggered by the financial crisis of 2007 and 2008, investment is desperately needed to fuel economic growth and job creation—including modernizing large swaths of our nation’s infrastructure. Repairing the system of distribution pipelines that deliver natural gasto homes and businesses offers an opportunity to drive significant investment in our economy. Doing so will help to fix a critical part of our aging infrastructure while creating jobs and cutting global warming pollution—a winning proposition for both the environment and the economy.

View this complete post...

Effects of Natural Gas Vehicles and Fuel Prices on Key Transportation Economic Metrics

Monday, July 7th, 2014
Figure 1: World, OECD, and U.S. Oil Demand (U.S. EIA, 2012)

WASHINGTON STATE DEPARTMENT OF TRANSPORTATION
This report responds to an inquiry by the State of Washington about the viability of natural gas as an alternative source of energy for transportation. The report is organized around responses to several key research tasks. These tasks are to: 1) Document the increase in supply of natural gas, estimate future price, and availability; 2) Assess the extent to which natural gas is likely to substitute for petroleum; 3) Estimate the extent to which price and performance effects will influence VMT trends in Washington State; 4) Estimate changes in GHG emissions in Washington State attributable to increased use of natural gas; 5) Estimate potential loss of fuel tax revenue attributable to substitution of natural gas for petroleum fuels.

View this complete post...

U.S. Crude Oil and Natural Gas Production in Federal and Non-Federal Areas

Friday, April 18th, 2014
Figure 1: U.S. Crude Oil Production: Federal and Non-Federal Areas, FY2009-2013

CONGRESSIONAL RESEARCH SERVICE
A key question in this discussion is how much oil and gas is produced in the United States each year and how much of that comes from federal versus non-federal areas. Oil production has fluctuated on federal lands over the past five fiscal years but has increased dramatically on nonfederal lands. Non-federal crude oil production has been rapidly increasing in the past few years partly due to favorable geology and the relative ease of leasing from private parties, rising by 2.1 million barrels per day (mbd) between FY2009-FY2013, causing the federal share of total U.S. crude oil production to fall by nearly 11%.

View this complete post...

The Electric Slide: Where America’s Energy Goes

Tuesday, April 15th, 2014
The Electric Slide (Infographic) | Where Americas Energy Goes

AMERICAN TRAINCO
Although we might consider electricity a primary source of energy in our lives since we use it for a variety of household items, electricity is actually a secondary source. Electricity is generated from primary energy sources like coal, natural gas, petroleum, and renewable energy sources like wood, biofuels, wind, and hydropower.

View this complete post...

Infographic: The Climate Risks of Natural Gas

Thursday, March 13th, 2014
The Climate Risks of Natural Gas

UNION OF CONCERNED SCIENTISTS

View this complete post...

Oil & Natural Gas Transportation & Storage Infrastructure: Status, Trends, & Economic Benefits

Wednesday, January 8th, 2014
Base Case Direct Capital Investments  Cumulative

AMERICAN PETROLEUM INSTITUTE
Over the past five years, unconventional oil and gas activity has thrust the nation into an unexpected position. The U.S. is now the global growth leader in crude oil production capacity growth, adding nearly 1.2 million barrels per day (mbd) of capacity over the 2008 – 2012 time period. In addition, the U.S. is now the largest natural gas producer, at 65 billion cubic feet (Bcf) per day. At the same time, unconventional activity is spurring the growth of natural gas liquids (NGLs) production, adding over 500,000 barrels of oil equivalent (boe) per day since 2008. This has brought the total increase in liquids production capacity to some 1.7 mbd since 2008.

View this complete post...

Natural Gas and Renewables in Texas

Thursday, December 12th, 2013
Table I-1: Overview of Modeled ERCOT Scenarios

THE TEXAS CLEAN ENERGY COALITION
In the electrically-independent power system of Texas known as ERCOT, the evolution of the power sector is especially related to the development path for renewable energy and natural gas-fired power. With over 12,000 MW of installed capacity, Texas is the largest state producer of wind-powered electricity in the U.S. Wind resources in Texas are more than double the next two largest wind capacity states combined. At the same time, Texas is the leading U.S. producer of natural gas, and the state generates nearly half its electricity from natural gas plants, substantially more than it generates from coal or nuclear power. Texas also has abundant, high-quality wind resources and solar energy potential.

View this complete post...

Follow InfraUSA on Twitter Facebook YouTube Flickr

CATEGORIES


Show us your infra! Show us your infra!

Video, stills and tales. Share images of the Infra in your community that demands attention. Post your ideas about national Infra issues. Go ahead. Show Us Your Infra!  Upload and instantly share your message.

Polls Polls

Is the administration moving fast enough on Infra issues? Are Americans prepared to pay more taxes for repairs? Should job creation be the guiding determination? Vote now!

Views

What do the experts think? This is where the nation's public policy organizations, trade associations and think tanks weigh in with analysis on Infra issues. Tell them what you think.  Ask questions.  Share a different view.

Blog

The Infra Blog offers cutting edge perspective on a broad spectrum of Infra topics. Frequent updates and provocative posts highlight hot button topics -- essential ingredients of a national Infra dialogue.


Dear Friends,


It is encouraging to finally see clear signs of federal action to support a comprehensive US infrastructure investment plan.


Now more than ever, our advocacy is needed to keep stakeholders informed and connected, and to hold politicians to their promises to finally fix our nation’s ailing infrastructure.


We have already engaged nearly 280,000 users, and hoping to add many more as interest continues to grow.


We require your support in order to rise to this occasion, to make the most of this opportunity. Please consider making a tax-deductible donation to InfrastructureUSA.org.


Steve Anderson

Managing Director


SteveAnderson@InfrastructureUSA.org

917-940-7125

InfrastructureUSA: Citizen Dialogue About Civil Infrastructure