


MINETA TRANSPORTATION INSTITUTE
Executive Summary
 This study examines the transportation performance of modern-era streetcars operated in five U.S. cities: Little Rock, Memphis, Portland, Seattle, and Tampa. The objective of the study is to examine streetcar performance, test hypotheses about variation in performance through a combination of empirical analysis and insights derived from key informant interviews, and to identify lessons for other cities that operate or are contemplating operating streetcars. The particular cities were selected to represent all modern-era streetcar services operating in year-round revenue service in the U.S. at the time of the study for which the authors could obtain relevant data. Services for which data were incomplete, such as Tacoma and historic legacy systems such as New Orleans and Philadelphia, are excluded from the investigation.
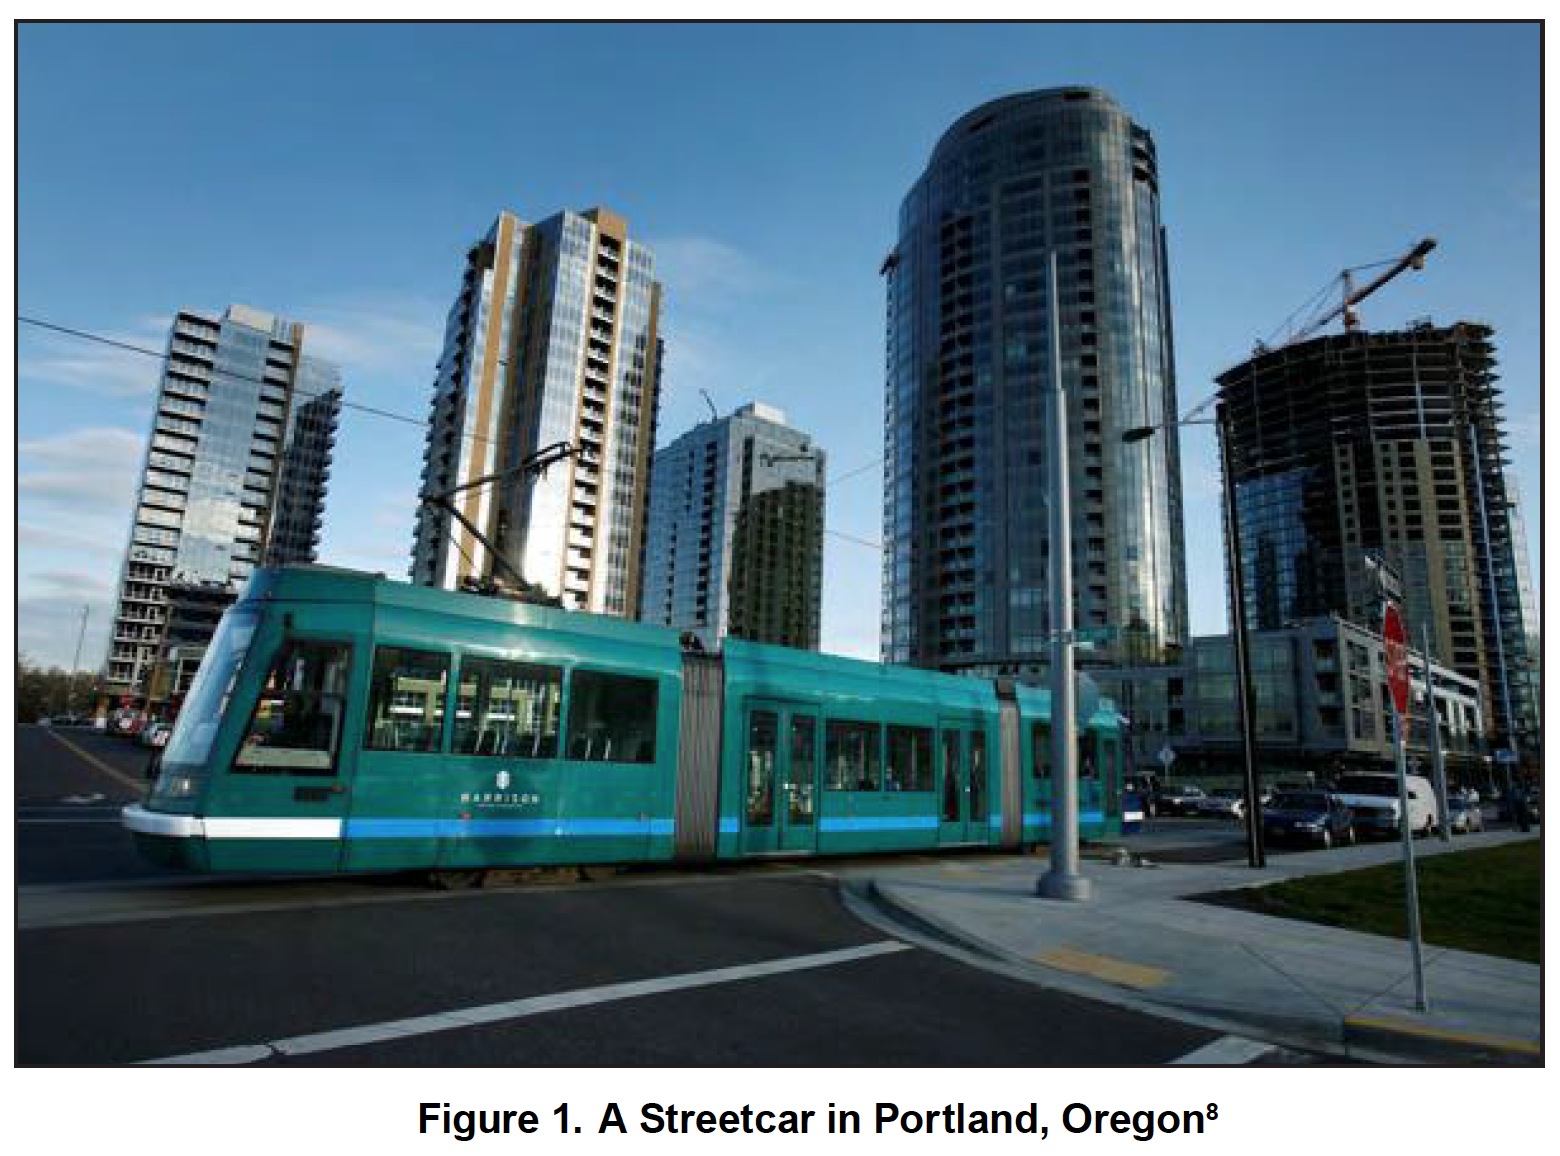
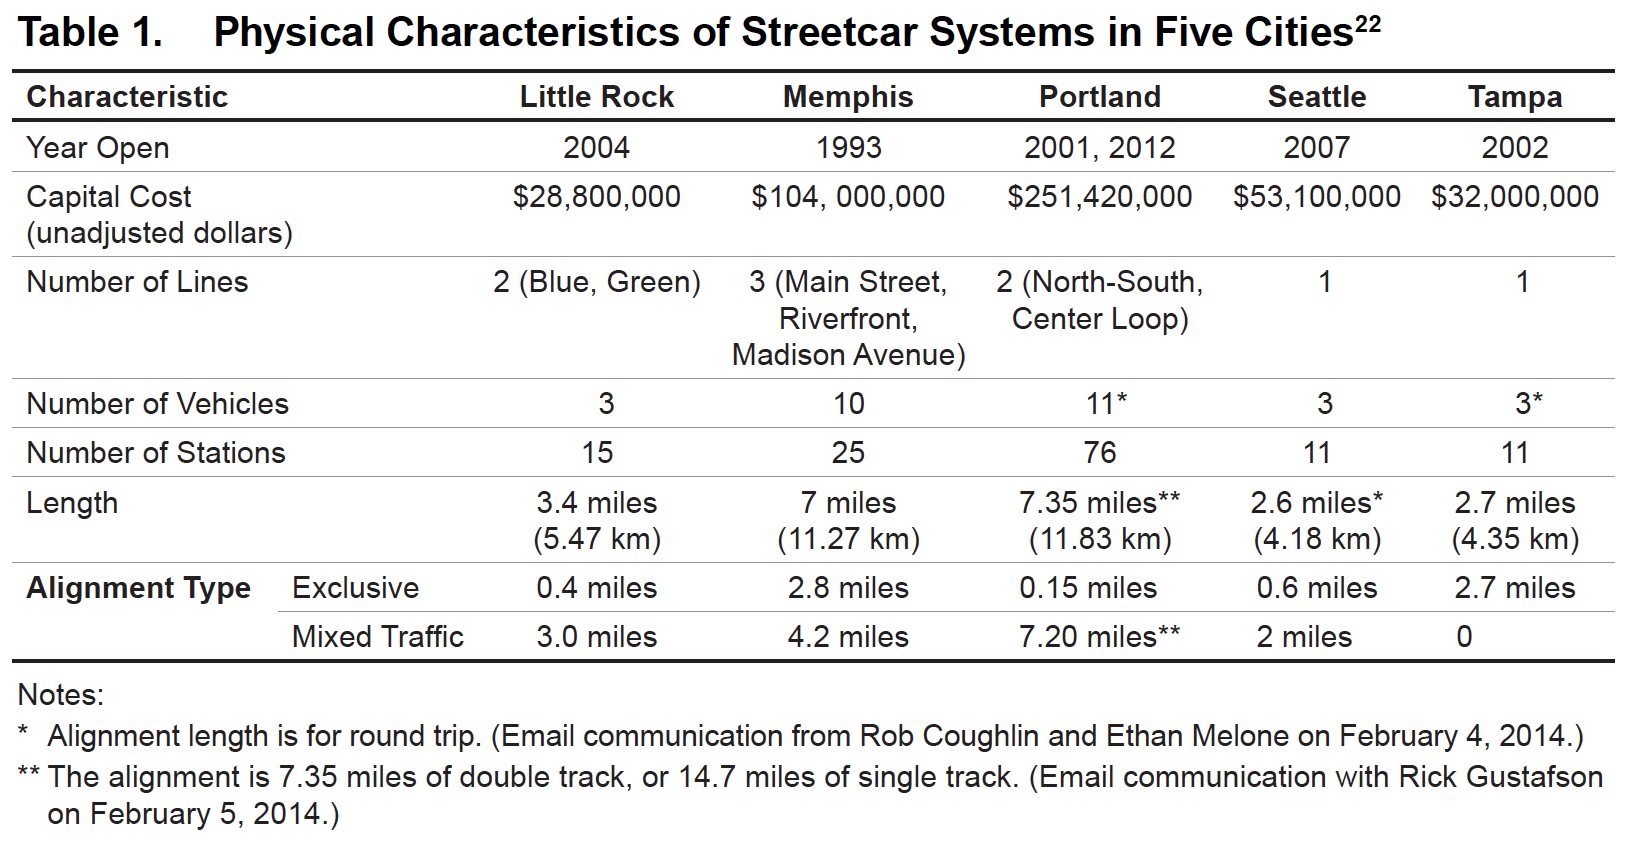
The streetcar lines in the five case-study cities were first opened between 1993 and 2007, with the most recent line opened in Portland in late 2012. Two cities (Seattle and Tampa) feature only a single line, two cities (Little Rock and Portland) operate two lines, and one city (Memphis) has three lines. The streetcar systems in Memphis and Portland are much more extensive and feature many more stops or stations than those in the other three cities, where the streetcars function as very short circulator services.
Streetcar service is operated by the local transit agency, either directly or under contract from another entity. However, the streetcar has a distinctive branding that differentiates it as a special service: River Rail (Little Rock), The Trolley (Memphis), Portland Streetcar (Portland), South Lake Union Streetcar (Seattle), and TECO Line Streetcar (Tampa). Streetcar services in these cities operate primarily in mixed-traffic environments, with Tampa being the only city that operates its streetcar entirely within an exclusive right-of-way. Service hours and service frequencies vary across the cities, with Tampa and Little Rock noteworthy for not operating streetcar service during the morning commuter period.
Streetcar Ridership and Transportation Performance
The authors examined streetcar ridership and other transportation performance measures for each city for 2012, as well as trends over time for the years immediately preceding 2012. Annual streetcar ridership was much higher in Portland than elsewhere, with patronage more than 2.5 times that of Memphis (the next-highest ridership city), and more than 30 times that of Little Rock (the lowest-ridership city). Little Rock, Memphis, and Tampa have a much more seasonal pattern to streetcar ridership than Portland or Seattle, which points to the importance of seasonal visitors as a key riding market in each of these three systems. The seasonal ridership pattern observable for the streetcar in the three cities is not apparent in its bus ridership. Average weekday streetcar ridership ranges from a low of about 400 riders per day in Little Rock to about 12,000 riders per day in Portland. In Little Rock and Tampa, ridership declined in the years leading to 2012, while in the other cities ridership was either stable or increased.
The authors also examined basic performance measures. Streetcar operating expenses range from a low of $2.61 per trip in Memphis, the most cost effective case, to a high of $9.61 per trip in Little Rock, the least cost effective case. Between 2008 and 2012, cost-effectiveness improved in Memphis and Seattle, and it deteriorated in the other three cities. In 2012, the streetcar system in Portland was by far the most productive (carried the most riders per unit of service), followed by that of Seattle. Little Rock, Memphis, and Tampa were much less productive. Between 2008 and 2012, service productivity declined in Little Rock and Tampa, and it improved in Memphis and Seattle. Data are incomplete for Portland due to the mingling of streetcar and LRT statistics in the original NTD data prior to 2011.
The authors finally identified a set of factors that might be related to streetcar performance in the study communities. The factors included: alignment (streetcar line length, and location with respect to population covered, employment covered, and special generators served), network coordination (streetcar accessibility to connecting transit services), fare policy (streetcar fare level, streetcar transfer policy), service policy (streetcar service frequency, streetcar service duration), and rider market (seasonality of streetcar ridership). The authors assigned each city a score between 1 (worst, or lowest ranked) and 5 (best, or highest ranked) for each factor, save for two factors that were scored on a binary basis (1= meets the ideal; 0= does not meet the ideal). The authors then compiled the rankings and related the results back to the ridership and performance measures noted earlier.
Portland emerged as the city whose streetcar system was planned and operates closest to the ideal suggested by the literature (total of 39 points out of 47 points possible), followed by Memphis (36 points) and Seattle (31 points). Tampa and Little Rock emerge with the lowest scores (16 points and 20 points, respectively). The two sets of cities ranked similarly on the factor assessment, as they do on the ridership and performance measures. Portland, Memphis, and Seattle were the better performers and Little Rock and Tampa the weaker performers on the ridership and transit performance measures. Portland’s emergence at the top of the point scale echoed its performance as the highest ridership, most productive, and second-most cost effective streetcar system. A critical difference between Portland and the other cities appears to be that planners and policymakers explicitly thought about the streetcar as transit and as a development tool when they made crucial decisions about the service, as the authors learned during interviews with key local informants.
About Mineta Transportation Institute
transweb.sjsu.edu
The Mineta Transportation Institute (MTI) conducts research, education, and information and technology transfer, focusing on multimodal surface transportation policy and management issues. It was established by Congress in 1991 as part of the Intermodal Surface Transportation Efficiency Act (ISTEA) and was reauthorized under TEA-21 and again under SAFETEA-LU. The Institute is funded by Congress through the US Department of Transportation’s (DOT) Research and Innovative Technology Administration, by the California Legislature through the Department of Transportation (Caltrans), and by other public and private grants and donations, including grants from the US Department of Homeland Security.
 RSS Feed