


BLOOMBERG NEW ENERGY FINANCE
Executive Summary
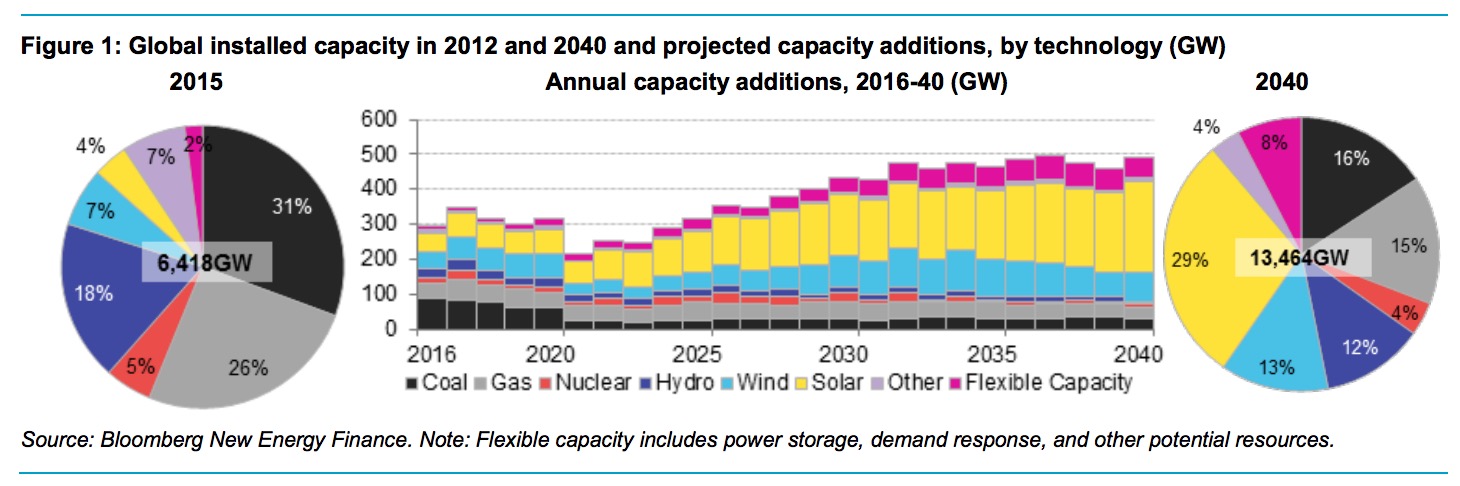
Cheaper coal and cheaper gas will not derail the transformation and decarbonisation of the world’s power systems. By 2040, zero-emission energy sources will make up 60% of installed capacity. Wind and solar will account for 64% of the 8.6TW of new power generating capacity added worldwide over the next 25 years, and for almost 60% of the $11.4 trillion invested.
- Weaker coal and gas prices have reduced the cost of electricity from new fossil fuel power stations. Recovering oil prices in the near term and the influence of rising US production costs on LNG markets in the longer-term will put upward pressure on gas prices, which we forecast rising to $6-9/MMBtu in 2040. Seaborne coal however appears to be in structural decline. Coal prices have been falling since their last peak in 2011 and a combination of China’s economic slow-down coupled with developed country emissions regulations, carbon prices, cheap gas and India’s plan to develop its domestic resources leads us to conclude that coal prices will remain low.
- At the same time wind and solar keep getting cheaper. While already competitive in a number of countries today without policy support, the cost of onshore wind is expected to drop 41% by 2040, driven primarily by improving capacity factors – which reach 33% on average in 2030 and 41% in 2040. The solar experience curve also marches on, but decline in technology cost is increasingly accompanied by a reduction in the cost of development, finance and operation pushing new utility-scale solar down 60% from a $74-$220/MWh range today, to a central estimate of around $40/MWh worldwide in 2040.
- Solar’s precipitous cost decline sees it emerge as the least-cost generation technology in most countries by 2030. It will account for 3.7TW, or 43%, of new power generating capacity added in 2016-40 and for over $3 trillion of new investment. Small-scale solar makes up a bit more than a third of this new capacity. Starting with Europe, Australia and the US but quickly spreading to India and other countries, households and businesses add solar PV on the rooftops to offset retail power bills almost everywhere. The bulk of solar PV is utility-scale, installation of which accelerates in China, Europe, the US and Africa from 2025 and in India from 2030. Overall, solar PV supplies 15% of world electricity by 2040, seeing an average $135bn invested per year over the next 25 years.
- Non-OECD countries will see the bulk of new capacity, with China and India leading the way. Renewables make up 61% of deployment in non-OECD economies but, in the absence of carbon policy, coal will continue to be important. In the next five years we see China adding almost 190GW of coal plants, but a moratorium on new coal plants there post-2020 will leave India, South East Asia and the Middle East adding the most new capacity thereafter.
- In the OECD, electricity demand fundamentals continue to look weak as economic and population growth fails to keep up with falling electricity intensity. Daily load profiles are also getting ‘peakier’, reflecting more household and commercial consumption and less steady industrial baseload. This trend, coupled with higher renewables penetration, means that power systems will increasingly need to reward system services such as demand response, battery storage, interconnectors and control systems that work along with traditional firm capacity to help match supply with demand. Around 336GW of this ‘flexible capacity’ is added in the OECD, and 938GW globally, to 2040.
- By around 2027, new wind and solar gets cheaper than running existing coal and gas generators, particularly where carbon pricing is in place. This is a tipping point that results in rapid and widespread renewables development. Repowering of existing wind sites also begins to make-up a larger fraction of activity in Germany, Denmark, California and China, accounting for 43% of wind development by the early 2030s.
- Over the next 25 years, electric vehicles will provide 2,701TWh of additional electricity demand, to reach 8% of world consumption. Our modelling suggests electric vehicles will make up 25% of the global car fleet by 2040, putting continuous downward pressure on battery costs through technology development, economies of scale and manufacturing experience. Cheaper batteries increasingly bring small-scale and grid-scale storage options into play.
- Small-scale PV reaches socket parity in all major developed economies and by 2020 we expect battery storage to become commonly deployed alongside rooftop systems. Driven by strong consumer uptake economics, over 10% of global generating capacity will be smallscale PV by 2040, though in some countries this share will be significantly higher. Adjoined battery systems increase the capacity factor of home solar systems by around 5 percentage points and help push around 1,795TWh of generation worldwide behind the meter.
- The cost of gas-fired power has fallen in line with oil prices and oversupply in the LNG market, making it broadly cheaper than renewables for the time being. However, in only a handful of countries do we see material uptake in new gas-fired power as a transition fuel. These include the US, where gas capacity grows by 97GW to 2040 – though the bulk of that happens in the years to 2030.
- As new wind and solar capacity is added worldwide, generation using these technologies rises ninefold to 10,591TWh by 2040, and to 30% of the global total, from 5% in 2015. By 2040, Germany, Mexico, the UK and Australia all have average wind and solar penetration of more than 50%. With the increase in renewable generation comes a fall in the run-hours of coal and gas plants, contributing to the retirement of 819GW of coal and 691GW of gas worldwide over the next 25 years. The fossil plant remaining on-line will increasingly be needed, along with new flexible capacity, to help meet peak demand, as well as to ramp up when solar comes offline in the evening.
- Despite retirements, coal generation remains almost flat to 2040. The combination of pollution regulations, carbon prices and a lack of electricity demand growth, drives net closure of 286GW of coal in OECD economies to 2040. Meanwhile, China’s moratorium on new coal-fired power post-2020 as it deals with its air pollution problems, coupled with its near-term slowdown in electricity demand growth, means that country sees 66GW less coal installed to 2040 than we anticipated last year. And despite some uptick in the near term, by 2020 US coal has joined Europe in terminal decline. However, low coal prices also mean more new coal capacity in countries such as India. It will see 258GW of new capacity and a trebling of coal consumption by 2040.
Download full executive summary (registration required): New Energy Outlook 2016
About Bloomberg New Energy Finance
about.bnef.com
Bloomberg New Energy Finance provides unique analysis, tools and data for decision makers driving change in the energy system.
Tags: Bloomberg, Bloomberg New Energy Finance, BNEF, Solar Energy, Wind Energy
 RSS Feed