


TRIP
Executive Summary
Eight years after the nation suffered a significant economic downturn, Nevada’s economy continues to rebound. The rate of economic growth in Nevada, which will be greatly impacted by the reliability and condition of the state’s transportation system, continues to have a significant impact on quality of life in the Silver State.
An efficient, safe and well-maintained transportation system provides economic and social benefits by affording individuals access to employment, housing, healthcare, education, goods and services, recreation, entertainment, family, and social activities. It also provides businesses access to suppliers, markets and employees, all critical to a business’ level of productivity and ability to expand. Reduced accessibility and mobility – as a result of traffic congestion, a lack of adequate capacity, or deteriorated roads, highways, bridges and transit facilities – diminishes a region’s quality of life by reducing economic productivity and limiting opportunities for economic, health or social transactions and activities.
With an economy based largely on agriculture, tourism, natural resource extraction and manufacturing, the quality of Nevada’s transportation system plays a vital role in the state’s economic growth and quality of life.
In this report, TRIP looks at the top transportation numbers in Nevada as the state addresses its need to modernize and maintain its system of roads, highways, bridges and transit.
In December 2015 the president signed into law a long-term federal surface transportation program that includes modest funding increases and allows state and local governments to plan and finance projects with greater certainty through 2020. The Fixing America’s Surface Transportation Act (FAST Act) provides approximately $305 billion for surface transportation with highway and transit funding slated to increase by approximately 15 and 18 percent, respectively, over the five-year duration of the program. While the modest funding increase and certainty provided by the FAST Act are a step in the right direction, the funding falls far short of the level needed to improve conditions and meet the nation’s mobility needs, and fails to deliver a sustainable, long-term source of revenue for the federal Highway Trust Fund.
Cost to Nevada Motorists of Deficient Roads
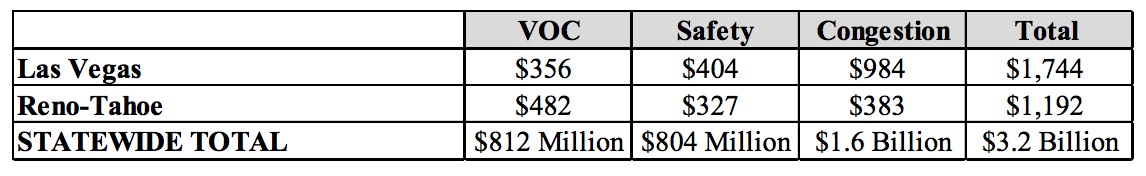
An inadequate transportation system costs Nevada motorists a total of $3.2 billion every year in the form of additional vehicle operating costs (VOC), congestion-related delays and traffic crashes.
- Driving on rough roads costs Nevada motorists a total of $812 million annually in extra vehicle operating costs. Costs include accelerated vehicle depreciation, additional repair costs, and increased fuel consumption and tire wear.
- Traffic crashes in which roadway design was likely a contributing factor cost Nevada motorists a total of $804 million each year in the form of lost household and workplace productivity, insurance and other financial costs.
- Traffic congestion costs Nevada drivers a total of $1.6 billion each year in the form of lost time and wasted fuel.
- The chart below details the average cost per driver in the state’s largest urban areas and statewide.
Population and Economic Growth in Nevada
The rate of population and economic growth in Nevada has resulted in increased demands on the state’s major roads and highways, leading to increased wear and tear on the transportation system.
- Nevada’s population reached approximately 2.9 million residents in 2015, a 45 percent increase since 2000 and the largest increase in the nation during that time.
- Nevada had 1.8 million licensed drivers in 2014
- Vehicle miles traveled (VMT) in Nevada increased by 48 percent from 2000 to 2015 – from 17.6 billion VMT in 2000 to 26.1 billion VMT in 2015. This was the largest VMT increase in the nation during that time.
- By 2030, vehicle travel in Nevada is projected to increase by another 30 percent.
- From 2000 to 2015, Nevada’s gross domestic product, a measure of the state’s economic output, increased by 28 percent, when adjusted for inflation. U.S. GDP increased by 27 percent during that time.
Nevada Road Conditions
A lack of adequate state and local funding has resulted in 24 percent of major urban locally and state-maintained roads and highways in Nevada having pavement surfaces in poor condition, providing a rough ride and costing motorists in the form of additional vehicle operating costs.
- The pavement data in this report, which is for all arterial and collector roads and highways, is provided by the Federal Highway Administration (FHWA), based on data submitted annually by the Nevada Department of Transportation (NDOT) on the condition of major state and locally maintained roads and highways in the state.
- Pavement data for Interstate highways and other principal arterials is collected for all system mileage, whereas pavement data for minor arterial and all collector roads and highways is based on sampling portions of roadways as prescribed by FHWA to insure that the data collected is adequate to provide an accurate assessment of pavement conditions on these roads and highways.
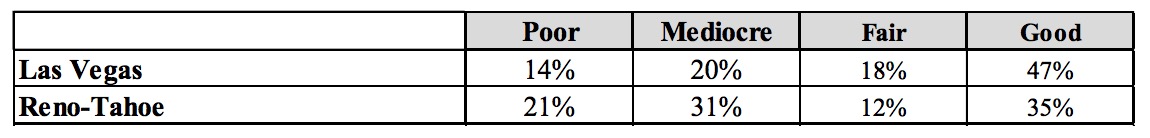
- Twenty-four percent of Nevada’s major urban locally and state-maintained roads are in poor condition, while 41 percent are in mediocre or fair condition. The remaining 35 percent are in good condition.
- The chart below details the share of major roads in poor, mediocre, fair and good condition in the state’s largest urban areas.
Roads rated in mediocre to poor condition may show signs of deterioration, including rutting, cracks and potholes. In some cases, these roads can be resurfaced, but often are too deteriorated and must be reconstructed.
Driving on rough roads costs Nevada motorists a total of $812 million annually in extra vehicle operating costs. Costs include accelerated vehicle depreciation, additional repair costs, and increased fuel consumption and tire wear.
Download full version (PDF): Nevada Transportation By the Numbers
About TRIP
www.tripnet.org
Founded in 1971, TRIP is a private nonprofit organization that researches, evaluates and distributes economic and technical data on surface transportation issues. TRIP promotes transportation policies that help relieve traffic congestion and its impact on air quality, improve road and bridge conditions, make surface travel safer, and enhance economic productivity. TRIP is sponsored by insurance companies, equipment manufacturers, distributors and suppliers, businesses involved in highway and transit engineering and construction, labor unions, and organizations concerned with an efficient and safe surface transportation network that promotes economic development and quality of life.
 RSS Feed