


SMART GROWTH AMERICA
Executive Summary
Some places in the United States are sprawling out and some places are building in compact, connected ways. The difference between these two strategies affects the lives of millions of Americans.
In 2002, Smart Growth America released Measuring Sprawl and Its Impact, a landmark study that has been widely used by researchers to examine the costs and benefits of sprawling development. In peer-reviewed research, sprawl has been linked to physical inactivity, obesity, traffic fatalities, poor air quality, residential energy use, emergency response times, teenage driving, lack of social capital and private-vehicle commute distances and times.
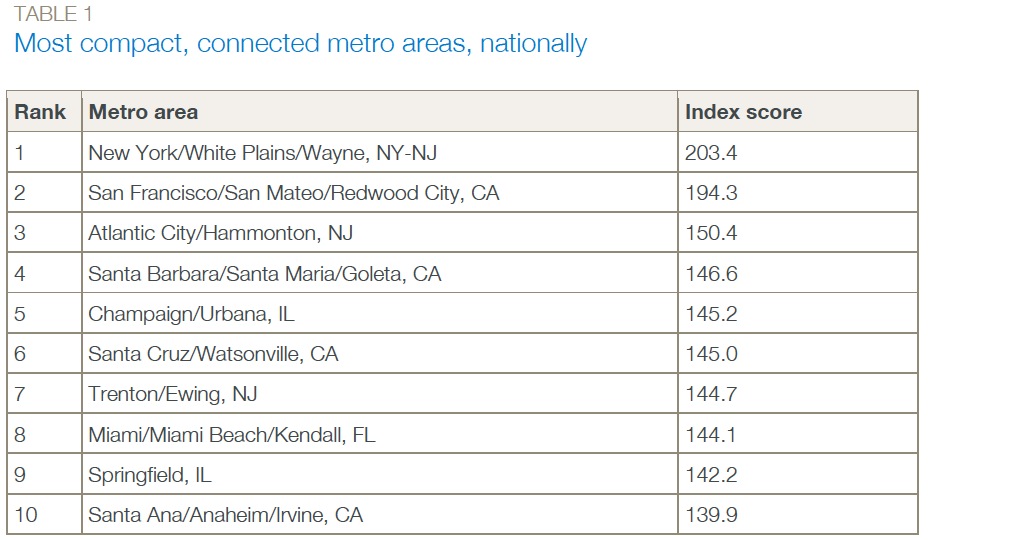
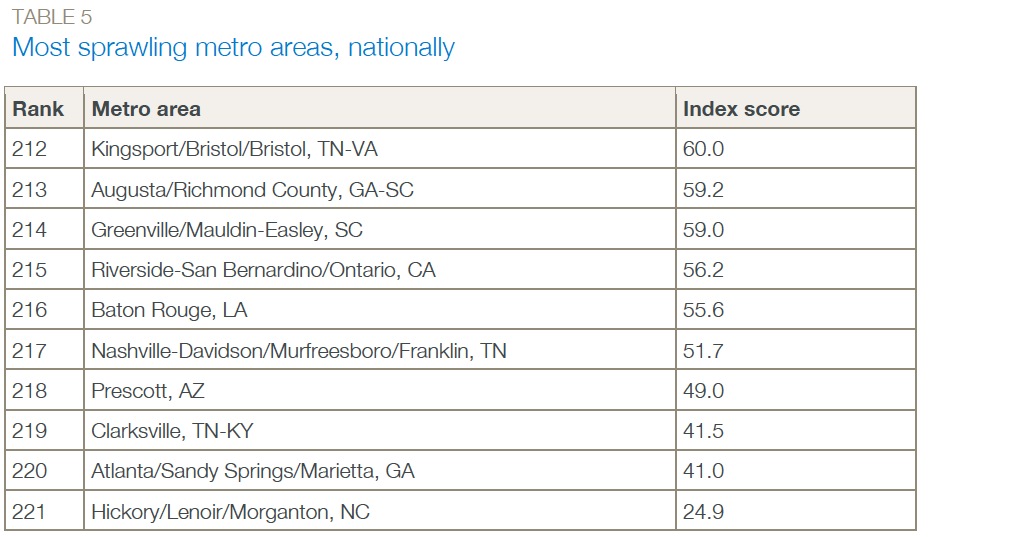
Measuring Sprawl 2014 updates that research and analyzes development patterns in 221 metropolitan areas and 994 counties in the United States as of 2010, looking to see which communities are more compact and connected and which are more sprawling. Researchers used four primary factors—residential and employment density; neighborhood mix of homes, jobs and services; strength of activity centers and downtowns; and accessibility of the street network—to evaluate development in these areas and assign a Sprawl Index score to each. This report includes a list of the most compact and most sprawling metro areas in the country.
This report also examines how Sprawl Index scores relate to life in that community. The researchers found that several quality of life factors improve as index scores rise. Individuals in compact, connected metro areas have greater economic mobility. Individuals in these areas spend less on the combined cost of housing and transportation, and have greater options for the type of transportation to take. In addition, individuals in compact, connected metro areas tend to live longer, safer, healthier lives than their peers in metro areas with sprawl. Obesity is less prevalent in compact counties, and fatal car crashes are less common.
Finally, this report includes specific examples of how communities are building to be more connected and walkable, and how policymakers at all levels of government can support their efforts.
…
Measuring “Sprawl”
This study analyzed development in 193 census-defined Metropolitan Statistical Areas (MSAs)—or metro areas—as well as 28 census-defined Metropolitan Divisions, which comprise MSAs, in the largest 11 MSAs. All of the analyzed areas had at least 200,000 people in 2010. MSAs with populations less than 200,000 people were not included in the study.1 This study also analyzed development in 994 metropolitan counties.
The Four Factors
Development in both MSAs and metropolitan counties was evaluated using four main factors: 1) development density; 2) land use mix; 3) activity centering; and 4) street accessibility. These factors are briefly explained below.
Development density
Development density is measured by combining six major factors: 1) total density of the urban and suburban census tracts; 2) percent of the population living in low-density suburban areas; 3) percent of the population living in medium- to high-density areas; 4) urban density within total built-upon land; 5) the relative concentration of density around the center of the MSA; and 6) employment density.
Land use mix
Land use mix is also measured through a combination of factors: the balance of jobs to total population and mix of job types within one mile of census block groups, plus the WalkScore of the center of each census tract.
Activity centering
The proportion of people and businesses located near each other is also a key variable to define an area. Activity centering is measured by looking at the range of population and employment size in different block groups. MSAs with greater variation (i.e., a wider difference between blocks with a high population and a low one) have greater centering. This factor also includes a measure of how quickly population density declines from the center of the MSA, and the proportion of jobs and people within the MSA’s central business district and other employment centers.
Street accessibility
Street accessibility is measured by combining a number of factors regarding the MSA’s street network. The factors are average length of street block; average block size; percent of blocks that are urban in size; density of street intersections; and percent of four-way or more intersections, which serves as a measure of street connectivity.
Scoring
Researchers used these factors to evaluate development in all 221 MSAs and 994 counties. These four factors are combined in equal weight and controlled for population to calculate each area’s Sprawl Index score. The average index is 100, meaning areas with scores higher than 100 tend to be more compact and connected and areas with scores lower than 100 are more sprawling.
Download full version (PDF): Measuring Sprawl 2014
About Smart Growth America
www.smartgrowthamerica.org
“Smart Growth America advocates for people who want to live and work in great neighborhoods. We believe smart growth solutions support thriving businesses and jobs, provide more options for how people get around and make it more affordable to live near work and the grocery store. Our coalition works with communities to fight sprawl and save money. We are making America’s neighborhoods great together.”
Tags: Pedestrian, Smart Growth America, sprawl, Suburbs, Walkability
 RSS Feed