


GEORGIA INSTITUTE OF TECHNOLOGY SCHOOL OF PUBLIC POLICY
Introduction
Power plants are one of the largest sources of carbon pollution in the U.S., accounting for nearly 39% of annual CO2 emissions from the combustion of fossil fuels (EIA, 2014, Table A.18). On June 2, 2014, the U.S. Environmental Protection Agency (EPA) proposed state-specific limits on CO2 emissions from existing fossil fuel-fired electric generating units (EGUs) as part of its Clean Power Plan (CPP). Using its authority to control air pollution from stationary sources under Section 111 of the Clean Air, EPA is moving forward to establish carbon pollution standards:
- §111 (b) authorizes the federal program to address new, modified and reconstructed sources by establishing standards.
- §111 (d) authorizes a state-based program for existing sources. The EPA establishes guidelines under which the states design programs and achieve the needed reductions.
§111 (d) provides the authority for the CPP. EPA is expected to publish a final rule in August 2015 requiring states to submit implementation plans as early as mid-2016. EPA is expected to offer states broad flexibility in the choice of compliance pathways; as a result, many states are vigorously engaged in examining alternative approaches to identify the compliance pathway that best meets their objectives.
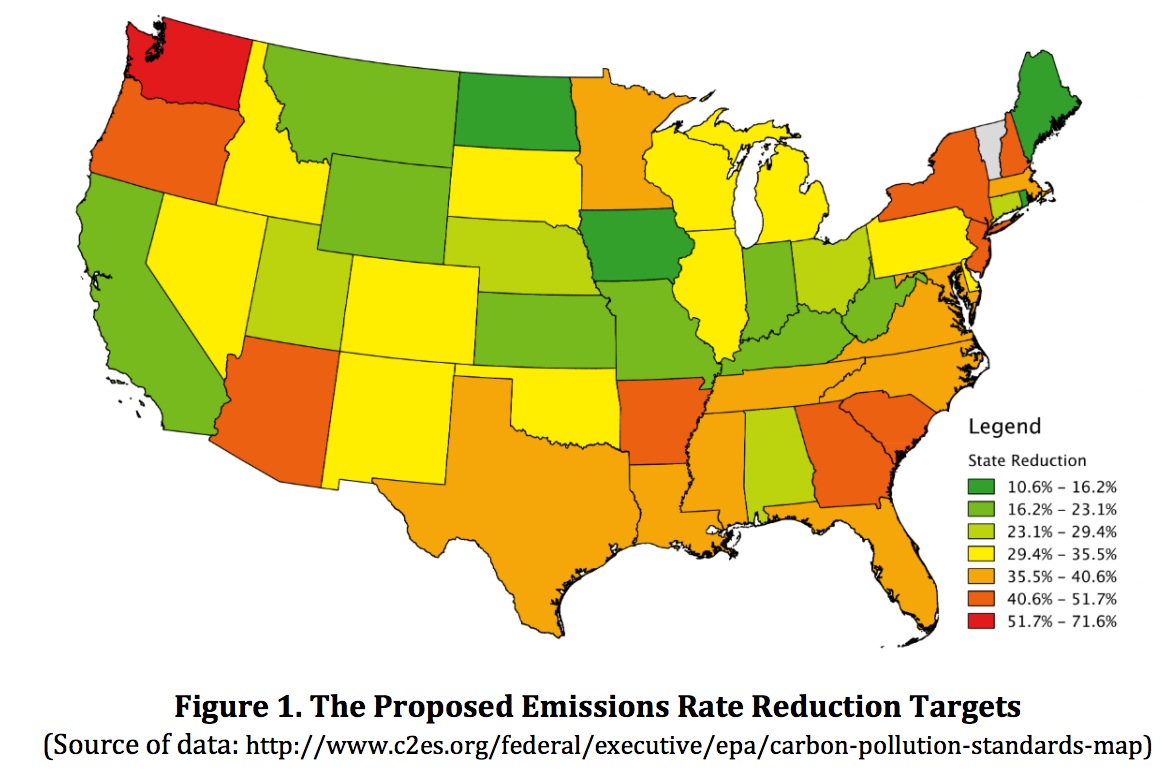
The CPP proposes a customized goal of CO2 emissions reductions for each state. Collectively, these goals would reduce the intensity of U.S. carbon emissions from the power sector (measured in pounds of CO2 emitted per MWh of electricity generated from affected EGUs) to 30% below 2005 levels by 2030. Each state is not expected to reduce its emissions by 30%. Instead, the EPA developed a “best system of emissions reduction” that takes into account environmental protection goals, technical feasibility, and cost effectiveness. The individual state goals are customized to take into account each state’s existing policies and current energy system. For example, the proposed plan would require Washington to cut its emissions by 72% in 2030 relative to 2012, while Kentucky has a proposed goal of only 18% emissions reduction. Georgia’s proposed goal is a reduction of 44% from 2012 to 2030. This variation reflects potential emissions reductions available to states as well as reductions expected from existing policies and planned coal plant retirements. Figure 1 shows the variation in proposed state emission rate targets across the country.
Under §111(d), EPA is empowered to establish an “emission guideline” based on the best system of emission reduction. Once EPA guidance is finalized, states will be required to develop implementation plans to comply. States have until June 30, 2016 to submit their action plans but can request extensions until June 2017 for individual plans, or until June 2018 for multi-state plans.
Compliance options include onsite actions at individual EGUs. For instance, states can undertake: (1) supply-side energy efficiency improvements (“heat rate improvements”), (2) fuel switching or co-firing of lower-carbon fuel; and (3) shifts in electricity generation from higher- to lower-emitting affected fossil units, such as the re-dispatch from coal to existing NGCC, with an increased utilization up to 70% of capacity. Heat-rate improvements could increase existing coal power plant efficiencies by 6%. More fully utilizing existing natural gas power plants would shift power generation from existing CO2-intensive coal power plants with an average rate of 2080 lbs/MWh to natural gas plants with an average rate of 1220 lbs/MWh.
Compliance options also include offsite actions that reduce or avoid emissions at affected EGUs. These include: (1) shifts from fossil generation to non-emitting generation such as nuclear or renewable generation and (2) reductions in fossil generation due to increases in end-use energy efficiency such as improvements in the efficiency of heating, cooling, lighting, manufacturing processes. EPA characterized the best practice for energy efficiency as a 1.5% incremental savings as a percentage of retail sales and for the rate of improvement used a 0.2% per year starting in 2017 (Southworth and Schwimmer, 2015a). For nuclear plants, 6% of 2012 nuclear capacity is considered to be “at risk” and contributes to the goal and all of the generation from units under construction and not operating in 2012 contributes to the goal. No additional new nuclear power plants were proposed other than those currently under construction in Georgia and South Carolina. In calculating state limits, EPA applied regional, annual RE growth rates to state 2012 RE levels, assuming that renewable electricity grows until the state reaches MWhs of renewable generation equal to 10% of 2012 generation or reaches 2029.
With the compliance flexibilities woven into the CPP, states have an array of options before them. On the supply side, they need to assess opportunities to shift the mix of fuels used to generate electricity in their state. On the demand side, they need to consider options for decreasing electricity consumption through energy-efficiency programs and policies. Administratively, states need to choose between adhering to an emissions intensity goal or an equivalent CO2 emissions goal. In addition, they can elect to prepare an individual plan or a multi-state plan, and in either event they can design a policy pathway that facilitates regional trading of allowances.
This report uses state-of-the-art energy analysis tools to evaluate the pros and cons of these alternatives compliance options. As an initiative of the Georgia Institute of Technology, we not only examine the costs and benefits of various policy pathways from a national perspective, but we also focus on the applicability of these pathways to the South, where opportunities and conditions may suggest alternative policy agendas. We begin with an overview of state goals for the Clean Power Plan (Section 2). Our research questions are specified in Section 3, which is followed by a description of our research methodology (Section 4). Findings are then presented, beginning with an assessment of the effectiveness, costs and benefits of alternative low-carbon policy pathways (Section 5), with a particular emphasis on their fuel mix implications. The modeling results are then used to inform the pros and cons of regional vs state approaches (Section 6) and mass vs rate goals (Section 7). The reduction of other air pollutants are described in Section 8, and conclusions are summarized in Section 9.
Download full version (PDF): Low-Carbon Electricity Pathways for the U.S. and the South
About the Georgia Tech University School of Public Policy
spp.gatech.edu
We house one of the world’s top programs in the field of science and technology (S&T) policy. We are a university partner in the European Union’s network of excellence in technology and innovation policy (“PRIME”), and we host a major international conference on S&T policy that brings participants from every continent. Because nearly every policy area is intertwined with S&T issues — the environment, communications, transportation, biotechnology and health, urban development, workforce and education, — the School is at the center of a wide range of important international, national, and state policy questions.
Tags: Emissions, Georgia Institute of Technology, Georgia Tech, GTSPP, School of Public Policy, South
 RSS Feed