


CLEAN EDGE
The U.S. Clean Tech Market
The United States has seen a significant shift in its energy landscape since Clean Edge began publishing its clean-tech leadership index five years ago. The transition to a clean tech and energy efficiency-based economy, based on the many indicators we track, is well underway. Solar and wind power, along with natural gas and energy efficiency, are now the mainstream choices for meeting the nation’s electricity needs; coal-fired and nuclear power, the dominant choices of the 20th century, have become the marginalized “alternatives.”
In 2014, utility-scale wind energy (27%) and solar power (20%) combined for 47% of U.S. generation capacity additions (this figure does not include distributed solar and wind installations less than 1 MW in size), according to the Federal Energy Regulatory Commission. Add in natural gas plants’ share of 49% and these three sources were responsible for 96% of the nation’s new utility-scale generation capacity. The clean-energy trend became even more dramatic in the first quarter of 2015, with non-hydro renewables contributing 70% of the new added capacity in the U.S. (wind 49%, solar 17%, and geothermal 4%).
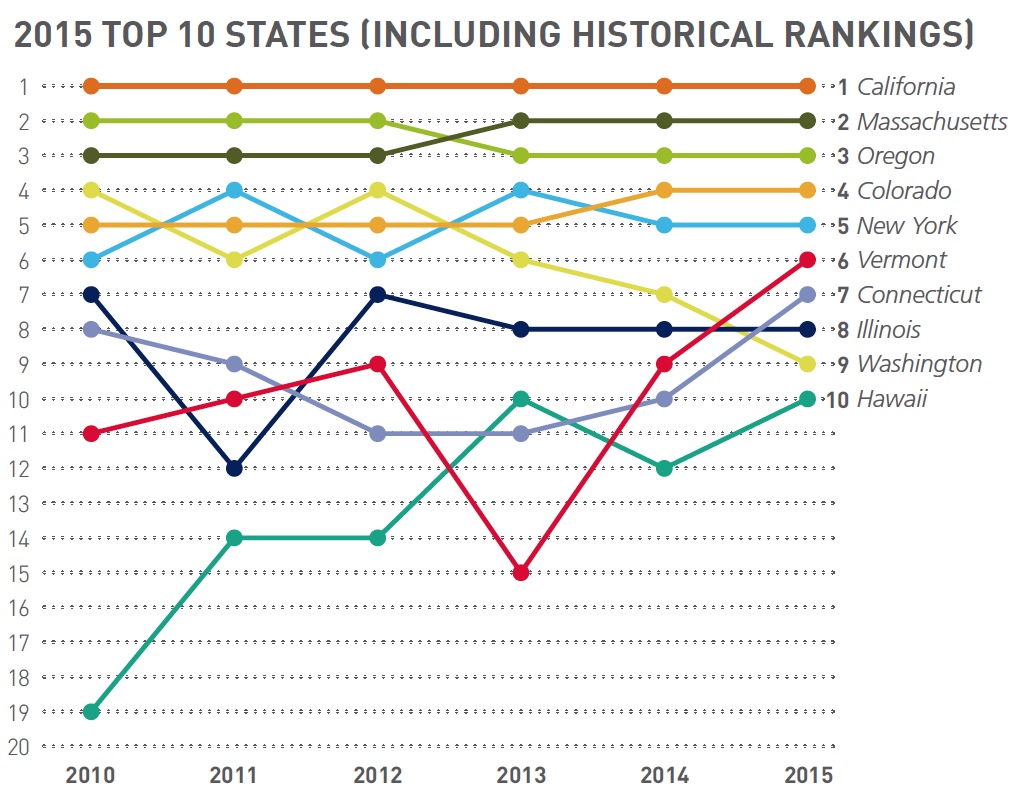
Against this national backdrop, the top states and metro areas tracked by our 2015 U.S. Clean Tech Leadership Index are accelerating their clean-energy goals to levels once believed unthinkable. In California, the #1 state in the Index for six consecutive years, Governor Jerry Brown set a target of 50% generation from renewables by 2030 in his January 2015 State of the State address. The California cities of San Francisco, San Jose, and San Diego (along with much smaller cities like Burlington, Vt., Georgetown, Tex., and Greensburg, Kans.) have renewable energy goals of 100%.
And lawmakers in Hawaii, a state that’s back in the top 10 in this year’s Index, made the biggest splash of all in May, establishing the nation’s first statewide 100% renewables target (by 2045). That audacious goal passed the two houses of Hawaii’s state legislature by a combined vote of 74-2 and was awaiting Governor David Ige’s expected signature as this report went to press; the Aloha State is currently at about 20% renewables.
Making these goals possible, in addition to the significant expansion of wind power over the past decade, is the recent surge in the growth of solar energy. The U.S. added more than 6 GW of new solar capacity in 2014, a 30% growth rate. California became the first state to exceed 5% generation from utility-scale solar, and that doesn’t even include the state’s hundreds of megawatts of rooftop solar working behind the residential and commercial customer meter. Utility-scale solar also contributed more than 2.5% of total generation in Nevada and Arizona.
Our tracking of states’ clean-tech performance since our first Index in 2010 puts this momentum in perspective. Last year, 11 states generated at least 10% of their electricity from clean sources (excluding hydro and biomass); in 2009, it was just three. And in 2014, three states exceeded 20% for the first time, led by Iowa at 28.5%. Add in hydro and biomass, and five states exceeded 60% clean electricity in 2014. As the EPA’s Clean Power Plan rolls out in the months and years ahead – and 100% clean-energy targets move from pipe dream to achievable goal – such state-by-state tracking of clean electricity sources, energy efficiency measures such as green buildings, and the move toward the electrification of transportation will be increasingly important.
Download full version (PDF): 2015 U.S. Clean Tech Leadership Index
About Clean Edge, Inc.
cleanedge.com
Clean Edge, Inc., founded in 2000, is the world’s first research and advisory firm devoted to the clean-tech sector. For more than a decade, the firm has delivered timely data, expert analysis, and comprehensive insights to key industry stakeholders. Clean Edge, with offices in the San Francisco Bay Area and Portland, Oregon, offers an unparalleled suite of index, benchmarking, and advisory services.
Tags: Clean Edge, Clean Tech, Rankings
 RSS Feed