


LOS ANGELES COUNTY BICYCLE COALITION
AARP
Findings
 1. Bike lanes have made streets safer, for people who bike and for all people using the roads.
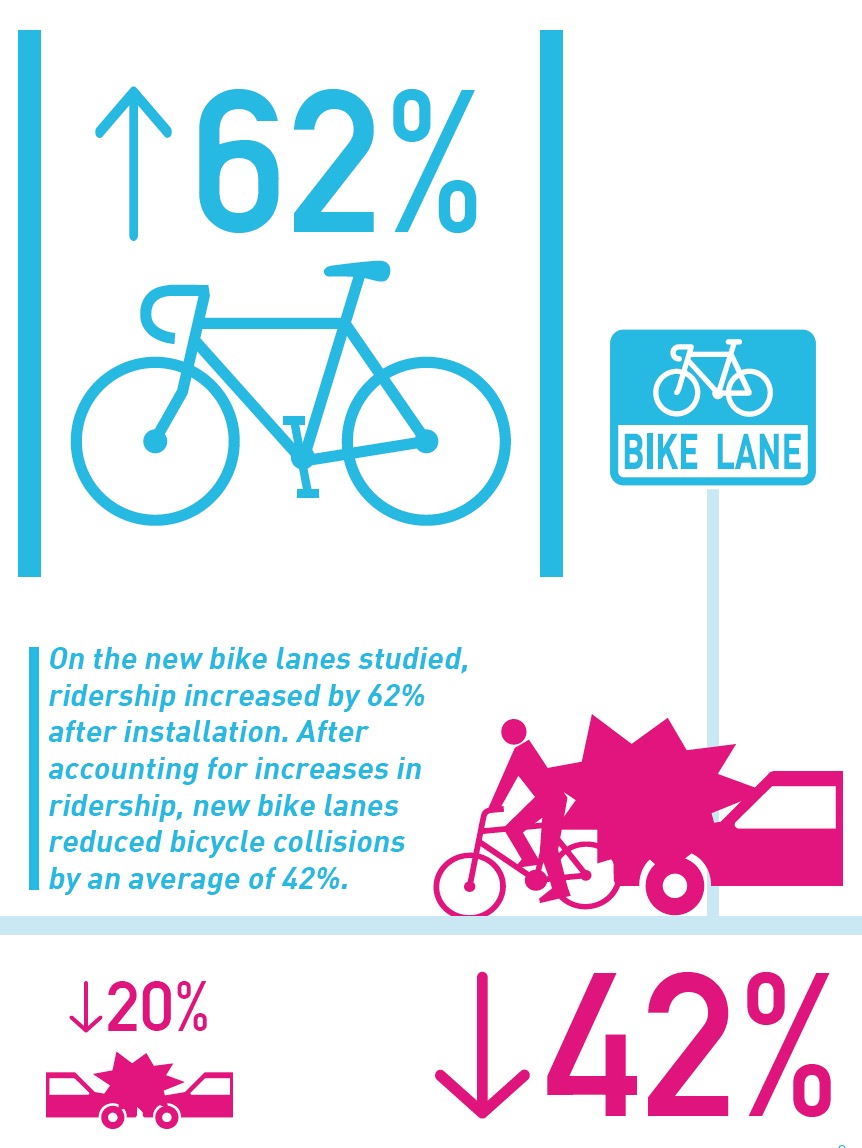
On the new bike lanes studied, ridership increased by 62% after installation. After accounting for increases in ridership, new bike lanes reduced bicycle crash risk by an average of 42%.
We looked at 8 of the 17 streets where bike lanes were installed between 2010 and 2015 with sufficient collisions and ridership data to draw conclusions about the effectiveness of the projects. Overall, the number of automobile collisions decreased, pedestrian collisions stayed relatively flat, and bicycle crash risk decreased, after accounting for increased ridership.
With several years of ridership and collision data now available on streets with new bike lanes, it is possible to calculate how changes to the streets have affected the crash risk for people riding on them. After a bike lane is installed, our data shows that more people start riding on that street. Sometimes when more people ride on a street, the total number of bike crashes also increases, while the percentage of crashes decreases. This gives a false impression that the new bike lane has made the street less safe, when in fact, the risk of crashing for each bike rider has actually decreased. Crash rates were calculated as a function of increased ridership.
These projects also benefited more than just the people riding bikes. Bike lanes that were installed by reducing the number of traffic lanes, known as road diets, reduced more collisions than bike lanes that were installed by just narrowing traffic lanes.
Case Studies: Road Diets Create Safer Streets for Everyone
Data from two road diet projects, Colorado Boulevard and 7th Street, illustrate these safety benefits. In both cases, the improvements are new, with relatively small sample sizes for the time period after installation. Therefore, these results should be treated as preliminary until additional data are available for a more robust analysis.
Case Study 1. Colorado Blvd – Eagle Rock
Colorado Boulevard, a major thoroughfare and commercial center in Eagle Rock, once had three travel lanes on both sides. In October 2013, 2.4 miles of the street were restriped into two travel lanes in each direction with buffered bike lanes. New crosswalks with flashing beacons were also installed.
After the road diet, bicycle ridership on Colorado Boulevard increased by 26%, while bicycle crash risk decreased by 87%. The number of car collisions decreased by 19%, while pedestrian collisions remained constant. Colorado Blvd became safer not only for people biking, but also for people driving. Businesses along the street are now easier to access and local residents can bike more safely around the neighborhood.
Case Study 2. 7th Street – Koreatown to Downtown LA
The bike lanes on 7th Street, west of downtown Los Angeles, were installed as one of the Bicycle Plan’s first projects. This corridor stretches from Downtown through MacArthur Park to Koreatown, providing convenient east-west connections in the central city area. The first phase between Catalina Avenue and Figueroa Street was installed in 2011. The extension from Figueroa Street to Main Street was installed in October 2013. The project implemented a standard road diet, in which two lanes in each direction were converted into one lane in each direction, plus a center turn lane and bike lanes.
After the road diet, 7th Street showed a significant increase in ridership from 44 people biking per hour to 68 people biking per hour (53% increase), while the bicycle crash risk decreased by 5%. During this same time period, all other types of collisions decreased. The intersection of Figueroa and 7th Streets is the second busiest intersection of all pedestrian count locations in the City of Los Angeles, with approximately 1,000 people per hour walking in the morning and 1,900 in the afternoon. After the road diet, the number of pedestrian-auto collisions decreased by 16% and auto-auto collisions decreased by 30%.
2. As bike lane installation has slowed, new ridership has decreased.
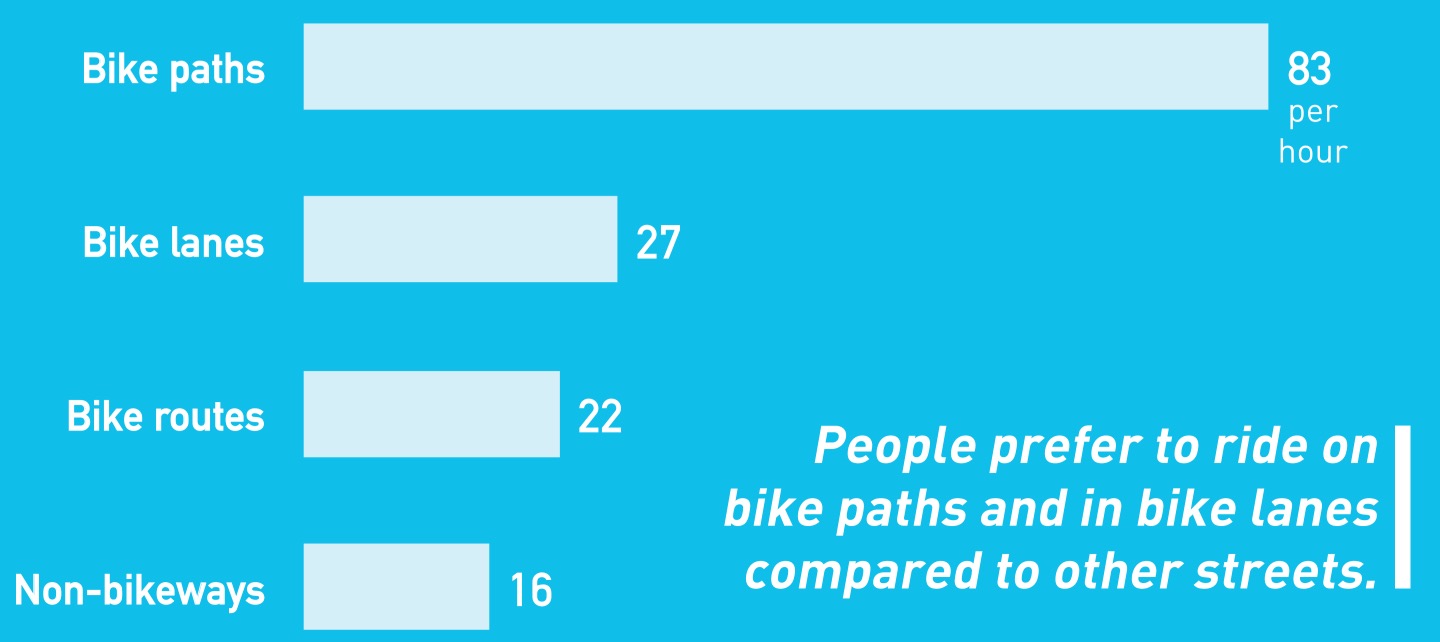
In previous years, LACBC has documented a direct correlation between new facilities and increasing ridership. In 2015, riders continued to gravitate towards bike lanes, however the count shows an overall 9% year-over-year decline in same location ridership from 2013 to 2015. This trend was not consistent over different facility types and commute periods. Ridership stayed about the same on streets with bike lanes, and decreased the most on streets with no bike facilities. In particular, 17 new bike lanes installed between 2010 to 2015 showed a 52% increase in ridership.
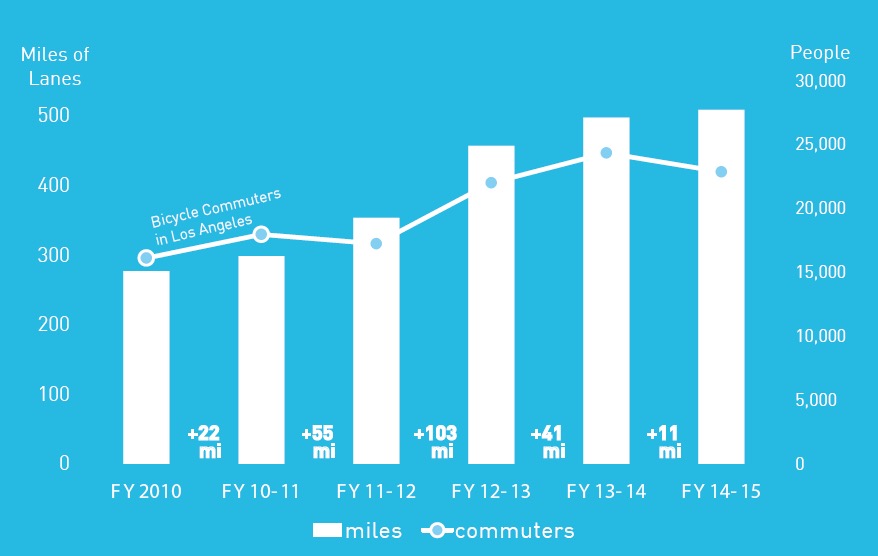
Travel patterns vary from day- to-day, week-to-week, and year-to-year. Factors like weather, holidays, and school schedules all contribute to natural variability that may not be accurately represented by one-day counts. Other data on bicycle travel show continued increase in ridership. For example, the American Communities Survey has shown a consistent, upward trend in bicycle commuting from 10,664 daily bike commuters (0.62% of all commuters) in 2006 to 24,334 bike commuters (1.30% of all commuters) in 2014.
In the last two years, bike lane installation has decreased significantly from a high of 101 miles in fiscal year 2013 to only 11 miles in fiscal year 2015. As a result, few bike lanes were added along count locations between the 2013 and 2015 counts, both of which occurred in September. Not only were fewer bike lanes installed in recent years, but many of these new lanes have been installations where bike lanes could be included in other road resurfacing or safety projects, rather than installations along high priority corridors identified in the Bicycle Plan. Of the initial 183 miles of bike lanes prioritized by objective criteria in the 5-year Bicycle Plan Implementation Strategy, only 45 miles (25%) have been installed. As a result, the bike network in Los Angeles remains fragmented with large gaps in bike lanes along most riders’ trips. This lack of connectivity continues to be the greatest barrier reported by many people who bike, or would like to bike. That there was little change in citywide ridership during a period of relatively little bike lane expansion implies a continued, direct relationship between new bike lanes and increasing ridership.
Download full version (PDF): 2015 Los Angeles Bike and Pedestrian Count
About the Los Angeles County Bicycle Coalition (LACBC)
www.la-bike.org
The Los Angeles County Bicycle Coalition (LACBC) is a membership-based nonprofit organization that works to make all communities in L.A. County healthy, safe, and fun places to ride a bike through advocacy, education, and outreach. Founded in 1998 by bicycle advocates Joe Linton and Ron Milam, LACBC brings together the diverse bicycling community in a united mission to improve the bicycling environment and quality of life for the entire region.
Tags: AARP, About the Los Angeles County Bicycle Coalition, Bicycling, CA, California, Cycling, LA, LACBC, Los Angeles, Road Diets, safety
 RSS Feed