TEXAS TRANSPORTATION INSTITUTE
One Page of Congestion Problems
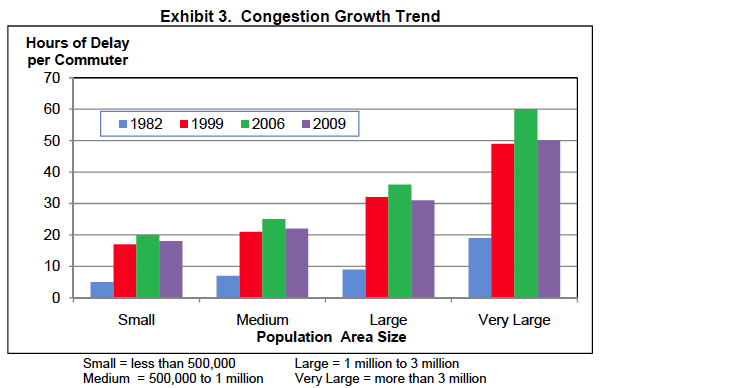
Travelers and freight shippers must plan around traffic jams for more of their trips, in more hours of the day and in more cities, towns and rural areas than in 1982. It extends far into the suburbs and includes weekends, holidays and special events. Mobility problems have lessened in the last couple of years, but there is no reason to expect them to continue declining, based on almost three decades of data. See data for your city at mobility.tamu.edu/ums /congestion_data.
Congestion costs are increasing. The congestion “invoice” for the cost of extra time and fuel in 439 urban areas was (all values in constant 2009 dollars):
- In 2009 – $115 billion
- In 2000 – $85 billion
- In 1982 – $24 billion
Congestion wastes a massive amount of time, fuel and money. In 2009:
- 3.9 billion gallons of wasted fuel (equivalent to 130 days of flow in the Alaska Pipeline).
- 4.8 billion hours of extra time (equivalent to the time Americans spend relaxing and thinking in 10 weeks).
- $115 billion of delay and fuel cost (the negative effect of uncertain or longer delivery times, missed meetings, business relocations and other congestion- related effects are not included).
- $33 billion of the delay cost was the effect of congestion on truck operations; this does not include any value for the goods being transported in the trucks.
- The cost to the average commuter was $808 in 2009 compared to an inflation-adjusted $351 in 1982.
Congestion affects people who make trips during the peak period.
- Yearly peak period delay for the average commuter was 34 hours in 2009, up from 14 hours in 1982.
- Those commuters wasted 28 gallons of fuel in the peak periods in 2009 – 2 weeks worth of fuel for the average U.S. driver – up from 12 gallons in 1982.
- Congestion effects were even larger in areas with over one million persons – 43 hours and 35 gallons in 2009.
- “Rush hour” – possibly the most misnamed period ever – lasted 6 hours in 2009.
- Fridays are the worst days to travel. The combination of work, school, leisure and other trips mean that urban residents earn their weekend after suffering one-fifth of weekly delay.
- 61 million Americans suffered more than 30 hours of delay in 2009.
Congestion is also a problem at other hours.
- Approximately half of total delay occurs in the midday and overnight (outside of the peak hours of 6 to 10 a.m. and 3 to 7 p.m.) times of day when travelers and shippers expect free-flow travel.
- Midday congestion is not as severe, but can cause problems, especially for time sensitive meetings or freight delivery shipments. Freight movement has attempted to move away from the peak periods to avoid congestion when possible. But this accommodation has limits as congestion extends into the midday and overnight periods; manufacturing processes and human resources are difficult to significantly reschedule.
Download full report: Urban Mobility Report 2010
About Texas Transportation Institute
tti.tamu.edu
“TTI’s program of practical, applied research helps hundreds of sponsors address a range of transportation challenges. For example, through decades of research in just the highway area—planning, design, construction, maintenance, safety and operations—virtually every mile of roadway in Texas has been positively impacted by some aspect of the TTI program. Through research, development and technology transfer, TTI is helping to meet the transportation needs of tomorrow.”
Tags: Texas A&M University, Texas Transportation Institute, TTI, TX


 RSS Feed