


UNIVERSITY OF CALIFORNIA, LOS ANGELES
Introduction
 When the University of California, Los Angeles opened its Westwood campus in 1929, the automobile had already come of age and was in full gear on Los Angeles’ Westside. For the next five decades that followed, getting people to and from UCLA was simply an exercise in parking cars.
Over time, however, as traffic congestion increased and air quality worsened in the Los Angeles region, UCLA saw an opportunity to address these concerns by creating a transportation program that would offer an array of alternative choices and lift the campus community out of the car culture it was born into. It began thirty-two years ago with the creation of an employee commuter vanpool program – a service that began with just four vans – and eventually expanded to become one of the largest employer owned commuter vanpool programs in the nation with over 144 routes currently in operation. Subsidized carpool, public transit, bike and walk programs soon followed. And as the previous timeline highlights, it took years of comprehensive planning, innovative pilot programs, and working strategically with campus partners to create UCLA’s strong sustainable transportation program that stands today.
In these pages, we will review UCLA’s current state of the commute for 2015, by sharing data, analyzing trends, highlighting recent achievements, and taking a look at what’s next for our commuting customers.
Commuter Characteristics
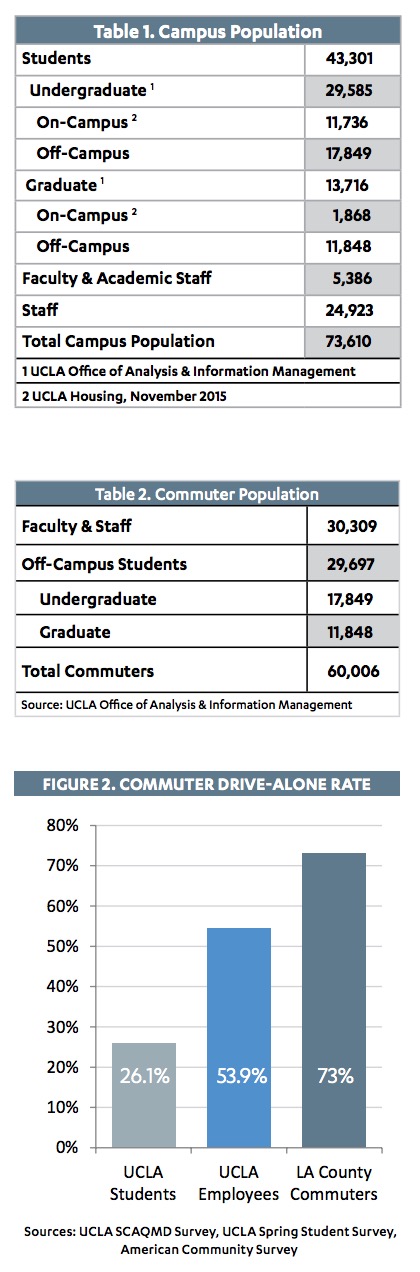
UCLA enrolled more than 43,000 students during fall quarter 2015, continuing to host the largest student population on the smallest acreage of land of any campus in the UC system.
Over the last five years, University enrollment has increased by more than 9%, with undergraduates increasing by 13% and the graduate student population growing by close to 2% (Figure 1). Though more than 13,000 students reside on campus (Table 1) and are therefore not counted as commuters, nearly 30,000 students commute from their off-campus residences to the University each school day. More than 5,000 faculty and nearly 25,000 staff members (not including residents, interns, graduate assistants, or other part-time workers) are employed at UCLA. Of the total population (73,610) 60,000 commute to campus on a regular basis (Table 2).
UCLA commuters are far less likely than their fellow commuters in Los Angeles County to travel alone in their automobile. The drive-alone rate for UCLA employees in 2015 was close to 54%, while the drive-alone rate for UCLA students came in at just over 26% in 2015 (Figure 2). In contrast, the drive-alone rate for all LA County commuters was nearly 73% in 2014 (the latest available year for this data).
University commuters used alternative transportation modes at a rate far higher than Los Angeles County commuters as a whole, a pattern that held true for all major modes. More than 15% of UCLA employees and more than 39% of students were pedestrians or bicycle commuters, options exercised by less than 4% of LA County commuters. Thirteen percent of UCLA employees and more than 25% of students commuted by public transit, compared to only 7% for all of LA County. Finally, more than 14% of UCLA employees commuted by carpool or vanpool, while 10% of LA County commuters used one of these modes.
Vehicle Trips and Traffic
UCLA Transportation conducts a traffic cordon count during the fall quarter each year over the course of one week in order to track the number of trips made to/from campus by cars (Figure 3). An average of 100,961 daily trips were taken to or from campus in 2015, a small increase compared to 2014 (Table 3). This total represents a decrease of nearly 5% compared to five years ago, despite a campus population increase of over 3,000 during the same period. The most heavily used gateway to campus is Westwood Plaza at Le Conte Avenue, which accounts for 16% of vehicle trips (Figure 4).
Mode Split
UCLA Transportation conducts two surveys annually that capture the commute habits of the University community: one for employees (SCAQMD Survey) and one for students (Student Transportation Survey).
The SCAQMD Survey satisfies the South Coast Air Quality Management District (SCAQMD) requirement for large employers (over 250 employees) to report the organization’s average vehicle ridership (AVR), which signifies the ratio of people to vehicles arriving at the worksite. The higher the AVR, the fewer vehicles there are in relationship to the population, which means more employees are carpooling, taking public transit, walking, telecommuting or engaging in some other alternative commute mode or work schedule. In 2015, UCLA achieved an AVR of 1.66, a slight decrease from the previous year’s 1.68 and well above SCAQMD’s mandatory compliance target of 1.50.
The Student Transportation Survey provides information on the travel patterns of undergraduate and graduate students residing both on and off campus. These two surveys are the sources for all UCLA mode split information contained in this report.
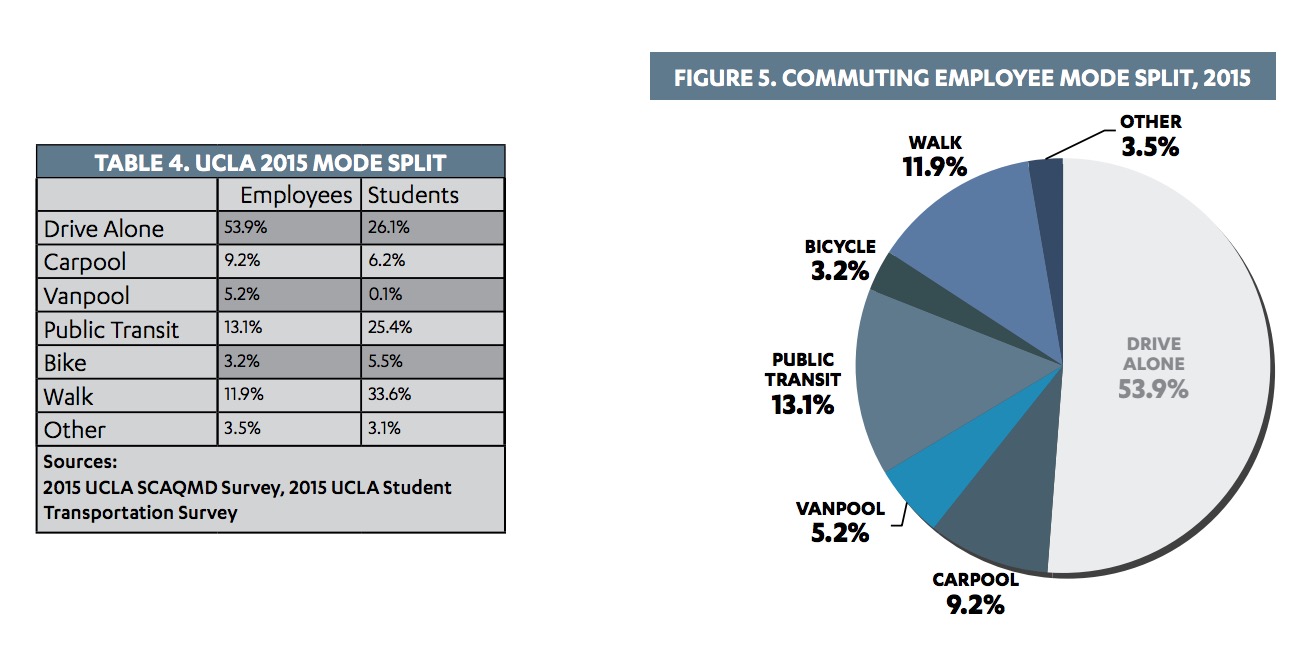
Approximately 40% of all UCLA commuters drive alone to campus, including close to 54% of employees and just over 26% of commuting students (Table 4). The remaining 60% of all commuters travel to UCLA by some form of alternative transportation, including carpool, vanpool, public transit, bicycling and walking.
Non-motorized transportation modes (bikes, scooters, pedestrians) account for more than 27% of all commuters, making this the largest block of alternative transportation users. Walkers constitute nearly 23% of all commuters, including 12% of employees (Figure 5) and close to 34% of students (Figure 6). More than 4% of commuters bicycle to UCLA, including more than 3% of employees and 5.5% of students.
More than 19% of all UCLA commuters take public transit, including 13% of employees and more than 25% of students. One-third of student public transit users ride the University-operated BruinBus, while the other two-thirds ride with one or more of UCLA’s six partner public transit agencies.
UCLA vanpools provide slightly less than 3% of all commutes to campus. Carpoolers make up nearly 8% of commuters, including more than 9% of employees and 6% of students. More than 3% of commuters come to UCLA by some mode other than those listed above. This group includes those that telecommute, are driven to campus and dropped off, ride a motorcycle, and other options.
More than 13,000 students live in residence halls or in other on-campus facilities. While these on-campus residents are not considered commuters, they still make an intra-campus trip to school each day and the transportation choices they make certainly have an impact on the University and the surrounding community. Trips to class or work for on-campus residents are dominated by non-motorized modes. Walking accounted for nearly 85% of on-campus trips, with biking adding an additional three percent. Seven percent rode BruinBus.
Mode choice varies greatly depending on the location of a student’s on-campus residence. Nine out of every 10 students in residence halls walked to class or work. For graduate residents living in Weyburn Terrace on the Southwest Campus, BruinBus was the mode of choice for nearly half of those students.
Download full version (PDF): UCLA State of the Commute
About the University of California, Los Angeles
www.ucla.edu
UCLA’s primary purpose as a public research university is the creation, dissemination, preservation and application of knowledge for the betterment of our global society. To fulfill this mission, UCLA is committed to academic freedom in its fullest terms: We value open access to information, free and lively debate conducted with mutual respect for individuals, and freedom from intolerance. In all of our pursuits, we strive at once for excellence and diversity, recognizing that openness and inclusion produce true quality. These values underlie our three institutional responsibilities.
Tags: CA, California, LA, Los Angeles, UCLA, University of California Los Angeles
 RSS Feed