


CENTER FOR RURAL PENNSYLVANIA
The Marcellus Shale Impacts Study Wave 2: Chronicling Social and Economic Change in Northern and Southwestern Pennsylvania
Executive Summary
Traffic concerns, especially truck traffic and road safety, have been identified in a number of studies in the Marcellus Shale region (Brasier et al., 2011). By some estimates, a single well in the Marcellus Shale region requires approximately 1,500 truck trips (Graham et al., 2015). In addition, motor vehicle deaths among workers in oil and gas industry are a leading cause of fatalities in the industry (Retzer et al., 2013). The number of additional trucks on the roads and the increased traffic due to gas worker transportation has raised significant concerns about the increased potential for accidents. This report supplements recently published findings on traffic impacts by providing the crash rates for four study counties in the project (Bradford, Lycoming, Washington, and Greene) in comparison to neighboring counties and for all counties in relation to the total number of wells drilled.
Two recently published studies directly related to traffic and road safety are reviewed. Food and Water Watch (2013) found that the number of heavy-truck crashes had been declining in Pennsylvania since 2000, but that this trend was seemingly curtailed with the onset of natural gas extraction. It found that rural counties with large numbers of wells saw a 7 percent increase in heavy truck crashes in the period just after wells were completed, while counties without wells showed a 12 percent decrease in heavy truck crashes. It also found that, from 2005 to 2010, there was a 9 percent annual increase in heavy truck crashes in counties with a high number of wells; conversely, there was a 3 percent annual decrease in other counties. Graham et al. (2015) found that counties with a high number of wells in the northern tier of Pennsylvania had 15-23 percent higher total crash rates in 2010-2012 and 61-65 percent higher heavy truck crash rates in 2011 and 2012 than other counties. They also found a 5-23 percent increase in crash rates was found for drilling counties. Finally, they found a 45-47 percent increase in fatal and major injury crashes in the southwest region in drilled counties for 2012.
This research describes three indicators of traffic – total crashes, heavy truck crashes, and crashes with fatalities. The trends over time are described in years prior to (2000-2007) and during (2008-2012/13) active well development periods. The study used annual data provided to the public by the Pennsylvania Department of Transportation (PennDOT) and the National Highway Traffic Safety Administration (NHTSA) for the years 2000-2013 and 2000-2012 respectfully. The data are provided as both the raw counts – as the total volume has importance for the provision of public services – and as rates for comparisons across counties.
Total Crashes: In Bradford County, the number of total crashes increased from 585 in 2009 to 848 in 2011 before declining again the next 2 years. Similarly, Lycoming County experienced an increase from 1,165 crashes in 2009 to 1,330 in 2011 before a decline in 2012-2013. Several counties in the northern tier region also had substantial increases in the number and rates of total crashes, including Tioga, Sullivan, Clinton, and Potter counties in 2009 and 2010. Greene County experienced an increase from 356 crashes in 2009 to 420 in 2012 before declining again in 2013. Washington County held relatively steady during this time period, and annual averages of 1,994 crashes for 2000-2007 and 2,006 crashes for 2008-2013. The southwestern region had little observable change in crash rates. The analysis of total crashes for all counties in the state suggest that, on average, the counties with 226 or more wells had a slightly higher increase in rates (16 percent) from 2009 to 2011, in comparison to counties with 1-225 wells, which averaged an 8 percent increase and counties with no activity that averaged a 5 percent increase.
Heavy Truck Crashes: Bradford and Lycoming counties experienced dramatic increases in the number and rate of heavy truck crashes from 2009 to 2011. There was a 344 percent increase in the number of heavy truck crashes in Bradford County and a 132 percent increase in Lycoming County. Other northern tier counties also experienced substantial increases: Tioga County experienced a 292 percent increase, Susquehanna County a 61 percent increase and Clinton County a 157 percent increase in the number of heavy truck crashes from 2009 to 2011. Greene County experienced a 74 percent increase, and Washington County a 24 percent increase in the number of heavy truck crashes between 2009 and 2011. The rates for other southwestern region counties show only slight increases. The analysis of the heavy truck crash data in relation to the number of wells drilled across all Pennsylvania counties indicates that while the overall trends of the three types of counties are similar, the years 2009-2011 show a larger increase for counties with high drilling activity compared to the other counties. Counties with the highest number of wells (226 or more) had a 56 percent increase, on average, in the number of crashes between 2009 and 2011. In contrast, counties with 1-225 wells had a 19 percent increase and counties with no wells had a 16 percent increase in the number of crashes. Similarly, the rate increased 75 percent in counties with a high number of wells, compared to 36 percent for those with fewer wells and 27 percent for those with no wells.
Crashes with Fatalities: The numbers of crashes with fatalities in all study counties is quite small, so small changes can lead to very dynamic patterns that are difficult to interpret. No apparent trends for the study counties or for the study counties in relation to neighboring counties were identified. However, the analysis for all counties as classified by the number of wells suggests that counties with the highest number of wells have steady or increasing numbers and rates of crashes with fatalities, while other counties experienced decreasing numbers and rates for the period of most active well development.
Although the information presented in this report is descriptive, it provides a means to understand traffic trends both prior to and during the heaviest phases of well development to date. Overall, the findings suggest that the most rural counties in the northern tier experiencing the highest levels of development – particularly Bradford, Tioga, Susquehanna, Clinton, and Lycoming – had increased absolute numbers and rates of total crashes and heavy truck crashes. The years of greatest impact appear to be 2009-2011, when activity was at its peak. The data for crashes with fatalities do not show any patterns. These findings are consistent with previous studies (Graham et al., 2015). For the 2012-2013 time period, and potentially in recent years, the number of crashes declined. This is likely due to two factors: decreased natural gas extraction due to low natural gas prices, and adaptations by operators and well servicing companies (such as using more piping for transporting water, recycling wastewater, and using rail to transport supplies). Both factors have likely led to a decline in the total number of trucks and oil and gas workers on the roads.
About this Project
The Marcellus Shale Impacts Project chronicles the effects of shale-based energy development in Pennsylvania by focusing on the experiences of four counties with significant extraction and production activity – Bradford, Lycoming, Greene, and Washington counties. Wave 1 of the project was completed in 2013 and Wave 2 began in early 2014. Wave 1 focused predominantly on data collection and the use of descriptive statistics to present changes in various outcomes over time. Wave 2 focused on developing statistical models to describe relationships between Marcellus Shale development and a set of social and economic indicators, identifying change in social and economic outcomes that are associated with Marcellus Shale development, and identifying the characteristics of people and places associated with the magnitude and types of impact experienced. A particular focus of Wave 2 was to explore the heterogeneity in Marcellus Shale development with respect to the intensity of drilling activity. This research focused on three indicators of traffic – total crashes, heavy truck crashes, and crashes with fatalities – to identify and describe changes in these outcomes over time and compare these trends with those in neighboring counties.
Study Counties
This study focused on the same four counties examined in Wave 1 of the Marcellus Shale Impacts Study: Bradford, Lycoming, Greene, and Washington. These counties experienced among the highest levels of Marcellus Shale development in Pennsylvania over the past 8 years, and they have diverse populations, histories, economic bases, and geographic locations. These differences allow comparisons that facilitate understanding of the potential associations between Marcellus Shale development and various social, economic, and health outcomes. Regional comparisons are also made based on adjacency to the study counties. The northern tier counties include Bradford, Lycoming, Clinton, Columbia, Montour, Northumberland, Potter, Sullivan, Susquehanna, Tioga, Union, and Wyoming. The southwestern counties include Greene, Washington, Allegheny, Beaver, Fayette, and Westmoreland.
All four study counties are classified as rural by the Center for Rural Pennsylvania with population densities of less than 284 people per square mile. However, the U.S. Department of Agriculture’s (USDA) Economic Research Service and the U.S. Census Bureau classify Lycoming and Washington counties as metropolitan counties. Lycoming County is in the Williamsport metropolitan area, and Washington County is part of the Pittsburgh metropolitan area. Bradford and Greene counties are classified by the USDA ERS as nonmetropolitan counties with small urban populations of less than 20,000 people. Both are adjacent to metropolitan areas.
Marcellus Shale Activity
Figure 1 presents the distribution of the cumulative number of wells drilled in each county in Pennsylvania through August of 2014. The cut points represent quintiles (intervals of 20 percent). Well development is concentrated in the northeast, northcentral, and southwestern portions of the state. In the northern tier, Bradford, Lycoming, Tioga, and Susquehanna counties have all experienced similar high levels of development. This suggests that comparisons of outcomes among these counties will be particularly useful. Similarly, the most useful comparisons will be between the neighboring southwestern counties with the most natural gas well development. These include Greene, Washington, Fayette, and Westmoreland, although Greene and Washington counties have had substantially more wells drilled than Fayette and Westmoreland counties.
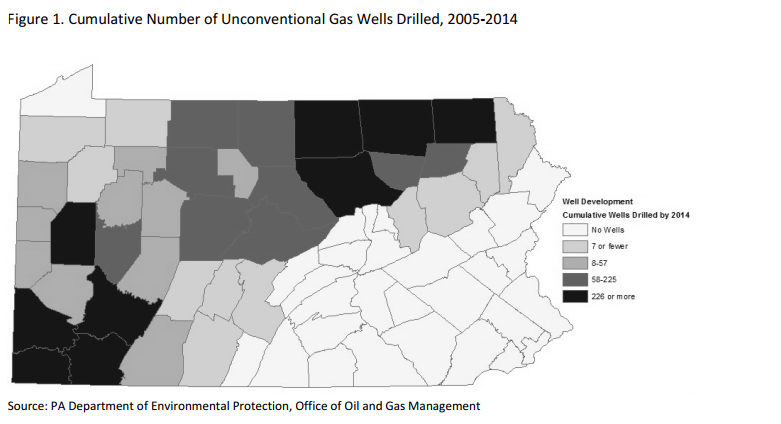
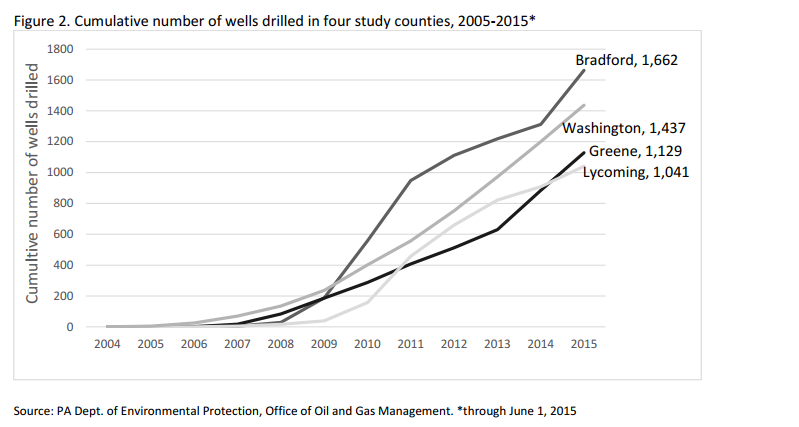
Figure 2 shows the cumulative number of unconventional wells drilled in the Marcellus Shale in the four study counties since 2005. Although some wells that were drilled early in the period may no longer be in production, and some new wells have not yet been put into production, the lines reveal overall trends in the study counties. The increase in wells drilled since 2009 has been substantial in all four counties, with Bradford and Washington counties experiencing the most pronounced increases. The increase in Bradford County was particularly robust between 2009 and 2011 and then leveled off to a slower growth rate after 2011. Lycoming experienced its steepest increase between 2010 and 2011, with steady but slightly lower growth rates after 2011. Development began earlier in the southwestern counties than in the northern tier counties, but growth in Washington and Greene counties has been relatively constant throughout the period with no dramatic spikes like those seen in the northern tier counties. Finally, although the pace of drilling appears to be leveling off in Bradford, Washington, and Lycoming counties, Greene County is continuing to experience an upward trend in development.
The next group of figures compares the cumulative number of wells drilled in the four study counties with their neighboring counties. Neighboring counties are defined as those that share a border or vertex (corner) with the study county. Although this report focuses on potential associations between Marcellus Shale development and traffic outcomes in the four study counties, counties do not exist in isolation. They are impacted by their neighbors, and given the spatial dependence of Marcellus Shale development (development is spatially clustered along the Marcellus Shale formation), traffic and traffic accidents may be affected not only by development in one county, but also by development in neighboring counties.
Due to the large number of neighboring counties, figures for the northern tier study counties are displayed separately to maintain visual ease. Figure 3 displays the cumulative number of wells drilled between 2005 through June 1, 2015 in Bradford County and its neighboring counties (Sullivan, Susquehanna, Tioga, and Wyoming). As can been seen from the figure, at 1,662, Bradford County has substantially more wells drilled than any of its neighboring counties. However, Susquehanna County has also experienced a rather large increase in drilling activity since 2008, and, if current trends continue, it could converge with Bradford County in the coming years.
Download full version (PDF): Transportation Impacts of Marcellus Shale Development
About the Center for Rural Pennsylvania
www.rural.palegislature.us
The Center for Rural Pennsylvania is a bipartisan, bicameral legislative agency that serves as a resource for rural policy within the Pennsylvania General Assembly. The Center works with the legislature, educators, state and federal executive branch agencies, and national, statewide, regional and local organizations to maximize resources and strategies that can better serve Pennsylvania’s nearly 3.5 million rural residents.
Tags: Center for Rural Pennsylvania, Drilling, Marcellus Shale, Marcellus Shale Impacts Project, Oil, PA, Pennsylvania, Rural, Shale
 RSS Feed