


SCHALLER CONSULTING
Who’s Who: For-Hire Ground Transportation Services
Taxicabs
- Until TNCs arrived, predominant provider of for-hire services in the United States.
- Door-to-door service (not shared between strangers)
- Fare based on initial charge, mileage and time
- Trips arranged via street hail, taxi stands, telephone orders and sometimes on-line or using smartphone app.
- Drivers treated as independent contractors, not employees
- Vehicle may be responsibility of driver or provided by company
- Drivers pay a daily, weekly or monthly lease fee.
Microtransit
- Shared-ride service in which passengers walk to a pick-up location.
- Via and Chariot are the largest companies in the U.S.
- Flat fares, typically around $5.
- Drivers usually paid an hourly wage
- Drivers are treated as independent contractors (Via) or employees (Chariot)
- Vehicle may be responsibility of driver or provided by company
Transportation Network Companies (TNCs)
- Sometimes called ride-hail or rideshare
- Uber and Lyft are largest companies; other companies are in specific markets
- Fare based on time and distance
- Primarily provide door-to-door private ride service (not shared between strangers), e.g., UberX and Lyft.
- Also provide shared trips which pick up additional passenger(s) after the first passenger(s) board, (e.g., UberPOOL and Lyft Line)
- Recently introduced variations on shared rides that involve passengers walking to a pick-up location (e.g., Uber Express POOL and Lyft Shared Rides)
- Trips arranged using smartphone app
- Drivers treated as independent contractors, not employees
- Companies charge a commission on fares
- Drivers responsible for providing their vehicle
Other Definitions
Trips, riders and ridership
- For bus, rail, walk and bike trips, these terms refer to one person traveling between two points except that, for bus and rail each boarding is counted separately. A trip involving a transfer from bus to Metro is thus counted as two riders and two trips.
- For personal auto, TNC and taxi, “riders” and “ridership” means one person making one trip between two points. “Trips” refers to vehicle trips. Two people traveling together in an auto, TNC or taxi count as two riders but as one trip.
Personal vehicle (or personal auto)
- Motor vehicle owned or leased by individuals or households, e.g., “the family car.” Does not include taxis or TNCs.
ADA Paratransit
- Transportation for people with disabilities who are unable to use the regular, fixed route rail and bus service.
- Usually a door-to-door service using vans and/or sedans.
- Trips are generally arranged in advance.
- Transit agencies are mandated to provide ADA paratransit service by the federal Americans With Disabilities Act (ADA).
- The service is typically provided by private companies under contract with the local transit agency.
Executive Summary
 Municipal and civic officials in cities across the country are grappling with how to respond to the unexpected arrival and rapid growth of new mobility services. These include ride services such as Uber and Lyft (also called Transportation Network Companies, or TNCs), “microtransit” companies such as Via and Chariot and more recently dockless bikeshare and electric scooter offerings.
Are these new mobility options friendly to city goals for mobility, safety, equity and environmental sustainability? What risks do they pose for clogging traffic or poaching riders from transit? What will happen when self-driving vehicles are added to ride-hail fleets?
While these questions are widely discussed, the information available to inform policy making is limited and often fragmentary. This report is designed to fill the gap, focusing on ride services (TNC and microtransit), which currently produce the most far-reaching issues among new mobility offerings.
This report combines recently published research and newly available data from a national travel survey and other sources to create the first detailed profile of TNC ridership, users and usage. The report then discusses how TNC and microtransit services can benefit urban transportation, how policy makers can respond to traffic and transit impacts, and the implications of current experience for planning and implementation of shared autonomous vehicles in major American cities.
Key results, conclusions, methodology and sources are summarized below. (Additional details on methods and sources are provided in section 2 of this report.)
Trips, Users and Usage
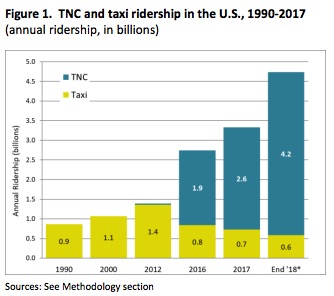
1) TNCs have more than doubled the overall size of the for-hire ride services sector since 2012, making the for-hire sector a major provider of urban transportation services that is projected to surpass local bus ridership by the end of 2018.
- TNCs transported 2.61 billion passengers in 2017, a 37 percent increase from 1.90 billion in 2016.
- Together with taxicabs, the for-hire sector is projected to grow to 4.74 billion trips (annual rate) by the end of 2018, a 241 percent increase over the last six years, surpassing projected ridership on local bus services in the United States (4.66 billion).
Sources/methodology: TNC trips and ridership based on published data on Lyft ridership and market share for 2017. Taxi ridership based on published data for 2012 and city-specific reports of declines since 2012. Bus ridership based on American Public Transportation Association data.
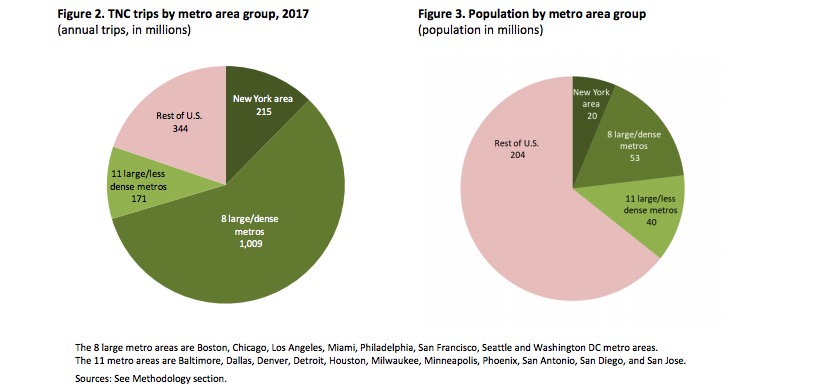
2) TNC ridership is highly concentrated in large, densely-populated metro areas. Riders are relatively young and mostly affluent and well-educated.
- 70 percent of Uber and Lyft trips are in nine large, densely-populated metropolitan areas (Boston, Chicago, Los Angeles, Miami, New York, Philadelphia, San Francisco, Seattle and Washington DC.)
- People with a bachelor’s degree, over $50,000 in household income, and age 25 to 34 use TNCs at least twice or even three times as often as less affluent, less educated and older persons.
Sources/methodology: National Household Travel Survey; published TNC trip totals in Massachusetts municipalities; industry sources.
3) TNCs dominate for-hire operations in large urban areas. But residents of suburban and rural areas, people with disabilities and those without smartphones continue to be reliant on traditional taxi services.
- TNCs account for 90 percent of TNC/taxi trips in eight of the nine large, densely-populated metro areas (New York is the exception) and in other census tracts with urban population densities.
- In suburban and rural areas, however, taxis serve slightly more riders than TNCs. The same is true in New York City (counting car services in the taxi category).
- People with disabilities make twice as many TNC/taxi trips as non-disabled persons, but taxis account for two-thirds of their TNC/taxi trips.
- TNCs account for only 13 percent of TNC/taxi trips taken by those without a smartphone.
Sources/methodology: National Household Travel Survey.
Download full version (PDF): The New Automobility: Lyft, Uber and the Future of American Cities
About Schaller Consulting
www.schallerconsult.com
Schaller Consulting offers expertise in urban transportation policy to serve the goals of enhancing mobility, economic vitality, social equity, environmental sustainability and road safety. Established in 1998, Schaller Consulting specializes applying transit improvements, new mobility services, street design, traffic and fleet management and road and parking pricing to enhancing multi-modal urban transportation networks, with an emphasis on integrating public engagement and performance evaluation with program planning and implementation.
Tags: Bruce Schaller, Lyft, microtransit, Rideshare, TNC, Transportation Network Companies, Uber
 RSS Feed