


AMERICAN COUNCIL FOR AN ENERGY-EFFICIENT ECONOMY (ACEEE)
Executive Summary
It has been a dynamic year for energy efficiency, with a mix of often competing forces at the national and state levels. In states including Virginia, New York, and New Jersey, policymakers unveiled plans for increased investment in clean energy and energy efficiency, driven in particular by concerns regarding climate change. Some states, in response to a possible loosening of federal vehicle and appliance standards, worked to keep efficiency standards in place at the state level. Others, like Iowa and Connecticut, saw attacks against efficiency within their states through legislation that results in reduced energy and utility bill savings. Despite a few setbacks, reasons for optimism remained abundant. Across the country, new opportunities for efficiency and distributed resources continued to arise through improved data access, policy innovations, and technological advancements like smart control systems, geographic targeting, electric vehicle grid integration, and energy storage.
States spent approximately $7.9 billion on energy efficiency in the utility sector in 2017 and saved close to 27.3 million megawatt-hours (MWh), a 7.3% increase from 2016. While average national investments and savings have leveled off somewhat in recent years, efficiency continues to make new inroads in the Southeast and in other states where it has been slower to take hold. With many states continuing to strengthen emissions reduction goals, policymakers and utilities are exploring new ways for efficiency to contribute to meeting climate targets. Overall, plenty of signs are pointing to policymakers’ growing appreciation of efficiency’s economic and environmental benefits and its role in strengthening the grid and transitioning to a clean energy economy.
The 2018 State Energy Efficiency Scorecard, now in its 12th edition, ranks states on their policy and program efforts, not only assessing performance but also documenting best practices and recognizing leadership. The report captures the latest policy developments and state efforts to save energy and highlights opportunities and policy tools available to governors, state legislators, and regulators.
Energy efficiency remains the nation’s third-largest electricity resource, employing 2.25 million Americans and typically providing the lowest-cost way to meet customers’ energy needs. Other benefits include improving air and water quality, strengthening grid resilience, promoting equity, and improving health and comfort. By calling attention to recent policy and programmatic successes, the Scorecard seeks to help states, utilities, and businesses realize all these benefits.
The Scorecard is divided into eight chapters. In Chapter 1, we discuss our methodology for scoring states (including changes made this year), present the overall results of our analysis, and provide several strategies states can use to improve their energy efficiency. Chapter 1 also highlights the leading states, most-improved states, and policy trends revealed by the rankings.
The next six chapters examine the policy areas in which states typically pursue energy efficiency:
- Utility and public benefits programs and policies
- Transportation policies
- Building energy codes and compliance
- Combined heat and power (CHP) policies
- State government–led initiatives around energy efficiency
- Appliance and equipment standards
The final chapter summarizes major policy highlights and setbacks occurring since the release of the last Scorecard and describes data limitations we encountered in our research. We also discuss developing trends in energy efficiency we hope to address with new metrics in future Scorecards.
KEY FINDINGS
Figure ES1 shows the states’ rankings, divided into five tiers for easy comparison. Later in this section, table ES1 provides details of each state’s scores.
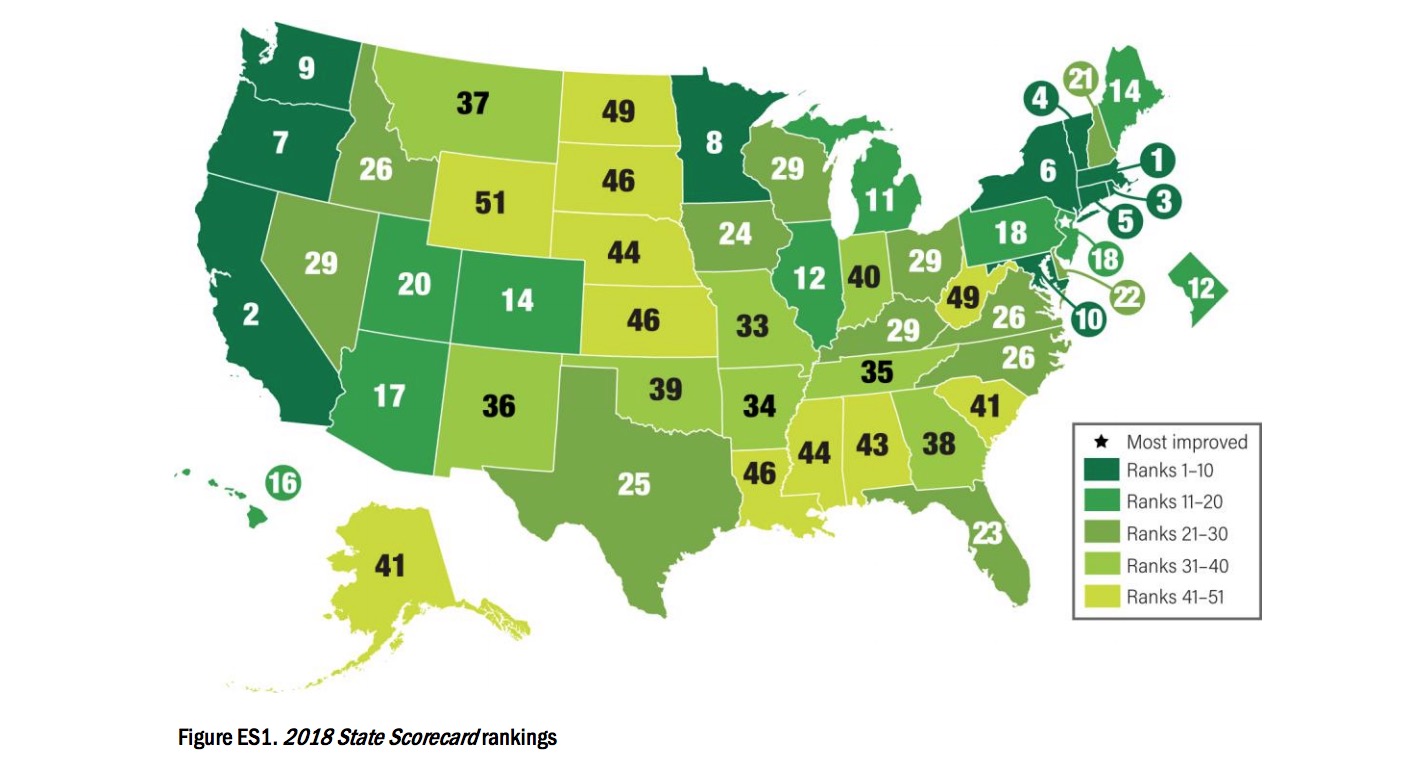
Massachusetts, California, and Rhode Island continued to set the pace for energy efficiency in 2018, occupying the top three spots thanks to advances on multiple policy fronts.
Massachusetts retained its hold on first place while capping off a busy year. Policymakers launched statewide energy efficiency planning efforts to set new three-year savings targets. The state’s Three-Year Energy Efficiency Plan also incorporates a fuel-neutral savings target. This reflects a growing trend among northeastern states to take a holistic approach to energy savings, including not only electricity and natural gas but also non-utility heating fuels. In addition, the state’s Department of Public Utilities issued an order in May approving $220 million in utility investment in grid-side modernization technologies over the next three years to improve efficiency and reliability and to pave the way for smart meter deployment. The state’s General Court also passed legislation that authorizes “strategic electrification” and carbon-reducing use of renewable energy through efficiency programs. The new law revitalizes progress toward statewide goals to slash greenhouse gas (GHG) emissions 80% by 2050 per the state’s Global Warming Solutions Act of 2008.
Finishing in second place and closing in on the lead was California, which passed several regulations to advance energy efficiency over the past year. In late 2017 the state’s Public Utilities Commission adopted long-term energy savings goals informed by SB 350 and AB 802. These major pieces of 2015 energy legislation called for doubling electric and natural gas savings by 2030 and shifted the energy use baseline to existing conditions in order to better target below-code savings. In 2018 the California Public Utilities Commission (CPUC) approved the first-ever set of business plans for the state’s investor-owned utilities, providing sector-level strategies and metrics to align utility programs with the new savings goals. This spring the state adopted new net-zero electricity building energy codes that will require all new single-family homes and low-rise apartment buildings to use solar and efficiency to zero out the building’s electricity demand. California also joined with eight other states in rolling out an updated zero-emissions vehicle (ZEV) action plan. This strategy pushes for the adoption of policies to accelerate the purchase of ZEVs in response to the US Environmental Protection Agency’s decision earlier in the year to freeze GHG emission standards for light-duty vehicles.
Rhode Island continued to hold its ground in third place. It achieved electric savings exceeding 3% of sales, among the highest reported levels anywhere in the United States, driven by an ambitious Three-Year Energy Efficiency Procurement Plan. In February the state also adopted a voluntary residential stretch code, based on elements of the US Department of Energy’s Zero Energy Ready Home program and the EPA’s WaterSense program. The code is intended to support sustainable energy goals described in the Resilient Rhode Island Act of 2014 to cut emissions 45% by 2035. Clean energy advocates ran into roadblocks on other policy fronts, however, with a bill stalling in the General Assembly that would have made the state the first in the nation with a carbon tax. Meeting a similar fate were proposed efficiency standards for lighting, computers, plumbing products, and other appliances. Yet the state continued to perform well in multiple Scorecard policy categories to finish in the top three for the second year in a row.
Vermont and Connecticut appeared in fourth and fifth place, respectively. Vermont‘s legislature passed H410 in May, enacting 16 new state appliance efficiency standards for computers and monitors, fluorescent tubes not covered by federal efficiency standards, plumbing fixtures, and other appliances. Among the 16 are three federal standards that were completed in recent years but never implemented. By 2025 the standards are expected to save consumers 435 million gallons of water and 59 million kilowatt-hours (kWh) of electricity annually, equating to roughly $17 million in savings per year.
Also finishing in the top five, Connecticut advanced efficiency in the buildings sector earlier this year by adopting the 2015 International Energy Conservation Code® (IECC), the second code update in two years. However ratepayer-funded efficiency programs endured a setback that is sure to adversely impact 2018 reported savings and could jeopardize Connecticut’s standing in next year’s Scorecard. State lawmakers closed 2017 by cutting the state’s energy efficiency funding by a third, redirecting $127 million over two years from the Connecticut Energy Efficiency Fund to make up a budget shortfall and forcing the Energy Efficiency Board to scale back programs. Seeking to lessen the damage, the state legislature acted in May to restore $10 million in efficiency funds for the 2019 budget. It also passed SB 9, expanding the state’s renewable portfolio standard and making administrative changes designed to protect energy efficiency funds from future legislative raids.
Also in the top 10 this year were New York, Oregon, Minnesota, Washington, and Maryland. Each of these states has well-established efficiency programs and policies and continues to push the boundaries by refining ways to enable energy savings. New York announced in the spring a plan to reduce energy consumption by 185 trillion Btus from forecast levels by 2025, a 50% increase over prior goals. The governors of Oregon and Washington also both signed major executive orders since the last Scorecard to accelerate energy efficiency in the built environment. Enacted last November, Oregon’s EO 17-20 lays out an ambitious plan to cut energy use and carbon emissions from state buildings and residential and commercial construction, directing updates to building energy codes to require electric vehicle–ready building construction as well as zero energy–ready homes. Similarly, Washington’s EO 18-01 calls on state agencies to prioritize the lease and purchase of low-emission vehicles and construction of zero energy or zero energy–capable state-owned buildings.
States Rising and Falling
The most-improved state this year was New Jersey. Other substantially improved states were Missouri, Colorado, South Dakota, and Connecticut. They posted the largest point increases over their previous year’s scores.
New Jersey improved by 4 points this year, the most of any state, and rose in the ranks from 23rd to 18th. Energy efficiency received a huge boost in the Garden State with the passage of Senate Bill 2314, establishing new annual energy savings targets for electricity and natural gas of 2% and 0.75% of sales, respectively, to be achieved within the next five years. The legislation also creates a new energy storage target, strengthens the state’s renewable portfolio standard, and sets energy benchmarking requirements for commercial buildings with more than 25,000 square feet of space.
Missouri improved by 2.5 points this year, rising from 37th to 33rd. Following a challenging 2016 in which energy efficiency programs were briefly suspended due to prolonged negotiations between utilities and state regulators, Missouri rebounded in 2017 with annual electric utility savings of 0.78%, the highest it has ever reported. The states’ electric utilities seem poised to build on their success, with Ameren Missouri filing plans in June 2018 to invest nearly $92 million annually in energy efficiency over the next six years and develop 15 new programs. The utility also introduced plans in February to incentivize the rollout of electric vehicle charging stations across the state and encourage commercial customers to transition to electric vehicles.
Other states making improvements included South Dakota and Colorado, which also added 2.5 points each. While South Dakota has long appeared in the bottom tier of the Scorecard, it rose three positions in this year’s ranking thanks to efforts to strengthen efficiency in the buildings sector. While South Dakota’s state-adopted building energy codes remain voluntary, many communities within the state have nevertheless updated local codes based on the 2015 IECC. Colorado moved up a spot into 14th place in recognition of the state public utilities commission’s raising the bar on utility savings. The commission approved new energy savings goals for Xcel Energy, an increase from 1.3% of electric sales to approximately 1.6%.
Connecticut also added 2.5 points, improving from sixth to fifth place, in part by advancing efficiency in the buildings sector through the adoption of the 2015 IECC. However, as mentioned, a raid of the state’s energy efficiency fund in late 2017 could negatively impact Connecticut’s standing in future Scorecards.
Not to be overlooked, Nevada also showed sizable progress in the wake of major state energy legislation passed in 2017. The law directs the Public Utility Commission to establish utility energy savings goals for NV Energy, allow program approval if the portfolio of utility energy efficiency programs is cost-effective, include non-energy benefits in benefit– cost analysis, and require a minimum spending level for low-income efficiency programs. While the PUC is still working with stakeholders to establish formal targets, NV Energy’s Joint Integrated Resource Plan and three-year Demand Side Management (DSM) Plan submitted earlier this year aim for annual savings of 1.15% in the next three years, a significant improvement on the state’s past efficiency efforts. The Silver State has also taken steps to strengthen sustainability in its transportation sector with the implementation of a statewide complete streets policy to design and retrofit streets and highways in a way that improves accessibility for all users, including pedestrians, cyclists, and people with disabilities.
By contrast, 18 states fell in the rankings this year and 19 lost points, because of changes in their performance as well as adjustments in our methodology, the latter including new metrics in the building policies chapter and the shift of 1 point toward appliance standards. Iowa fell the farthest, losing 3.5 points. This drop was largely due to the signing earlier this year of bill SF2311, which imposes a restrictive spending cap on efficiency programs, removes efficiency program requirements that had been placed on municipal utilities and co-ops, and allows customers to opt out of paying for efficiency programs that fail to satisfy the ratepayer impact (RIM) test, a cost-effectiveness measure rejected by most states as inequitable. Early indications from utility filings point to a forecast drop in savings of 25– 50% for electric programs and 75–80% for gas programs, further jeopardizing Iowa’s rank in future Scorecards.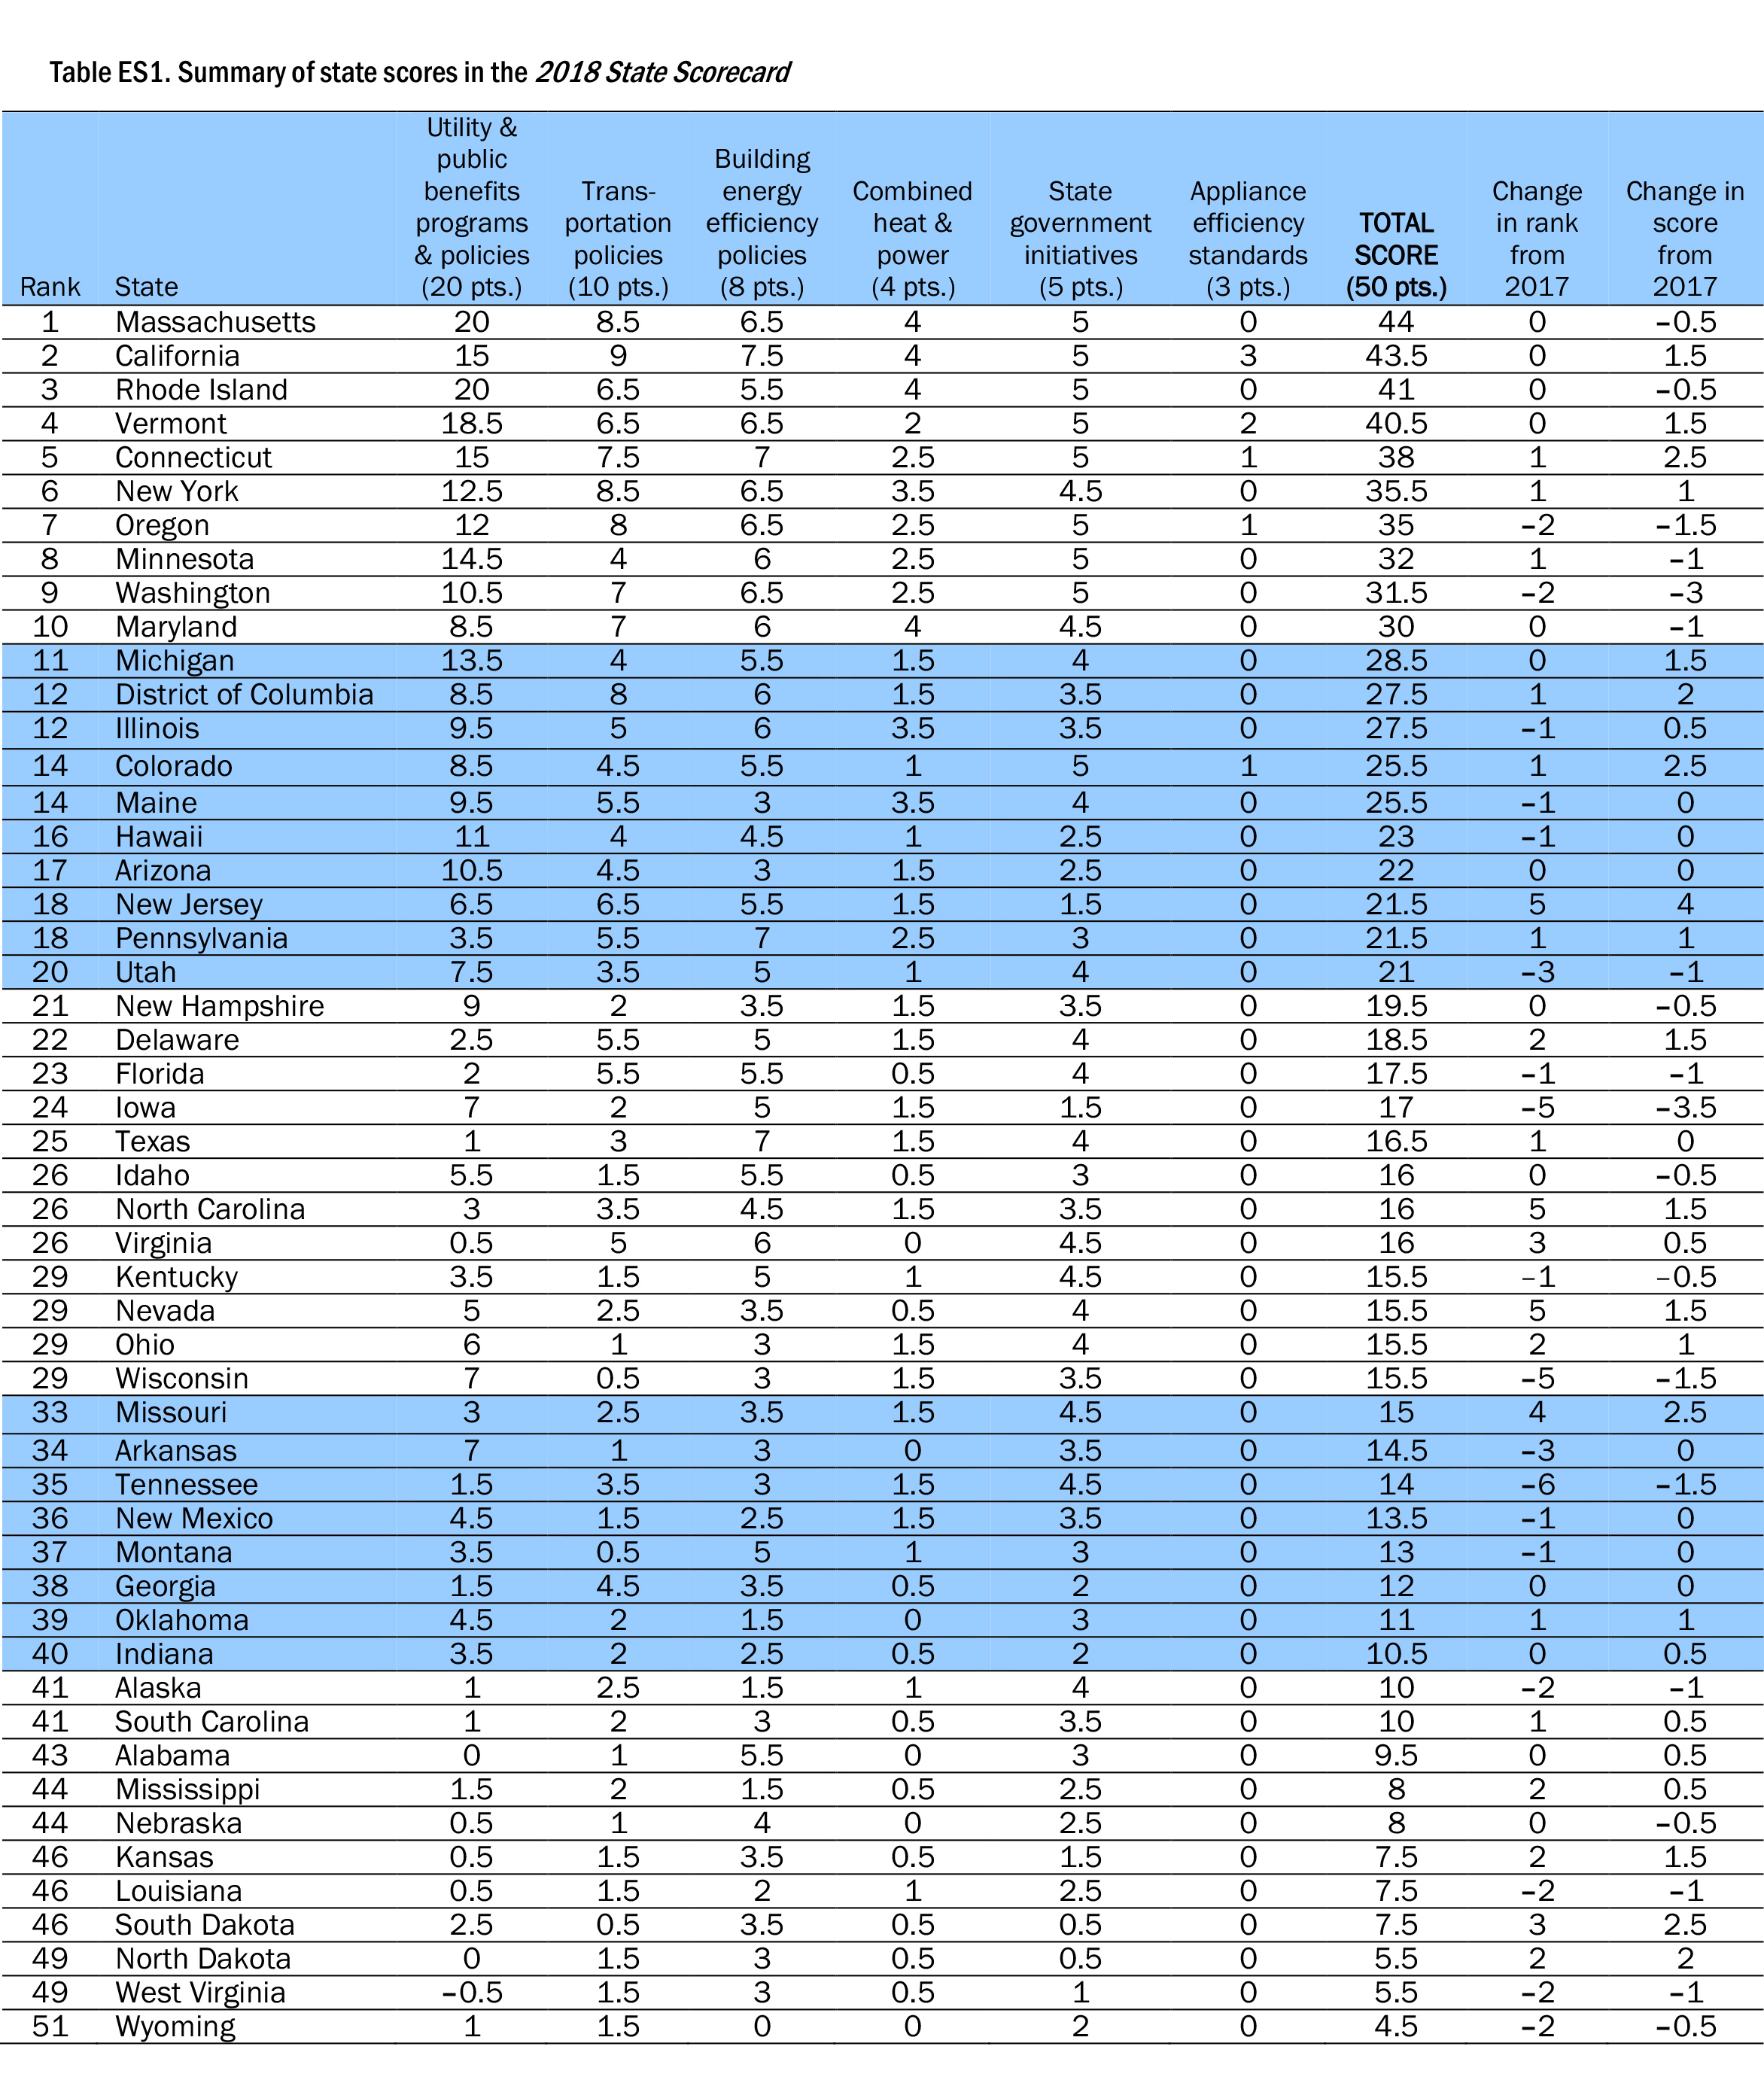
Download full version (Registration Required): The 2018 State Energy Efficiency Scorecard
About the American Council for an Energy-Efficient Economy
https://aceee.org/
The American Council for an Energy-Efficient Economy (ACEEE), a nonprofit, 501(c)(3) organization, acts as a catalyst to advance energy efficiency policies, programs, technologies, investments, and behaviors. We believe that the United States can harness the full potential of energy efficiency to achieve greater economic prosperity, energy security, and environmental protection for all its people.
Tags: 2018 State Energy Efficiency Scorecard, ACEEE, American Council for an Energy-Efficient Economy, Energy efficiency, Energy Efficiency Scorecard
 RSS Feed