Support for InfrastructureUSA.org
has been provided by these organizations and individuals:

John Hennessy III,
P.E.

Posts Tagged ‘Interactive Map’

Interactive Map: California Climate Investments

Wednesday, August 26th, 2015
California Climate Investment Map - broad

A new interactive map from the State of California shows just how serious the Golden State is about the climate. Literally hundreds of pins dot the map, from San Diego to Humboldt, and each one represents a unique effort to mitigate climate change and promote sustainable living.

View this complete post...

Interactive Map: Visualizing Urban Watersheds

Friday, November 21st, 2014
Los Angeles Freshwater Sources

Want to learn more about water’s journey to reach your tap? Check out The Nature Conservancy’s massively informative Urban Water Blueprint.

View this complete post...

Interactive Map: Climate and Energy by State

Thursday, October 9th, 2014
Electricity Generation from Renewable Energy

Curious how your state stacks up when it comes to sustainability, renewable energy or climate-friendly policies? The Georgetown Climate Center’s new interactive map includes all these parameters (and much more) in its colorful, easy-to-read interface. With the center’s proprietary State Energy Analysis Tool as the engine, this map offers insight into a wide range of data that’s otherwise hard to come by, from Electricity Market Regulation to Energy Exporters and Importers. State profiles offer an in-depth analysis of each state’s energy/climate breakdown.

View this complete post...

San Francisco Bay: Interactive Map Makes Bike Share Easy

Friday, August 15th, 2014

For travelers, visitors, or even die-hard fans who want to make the most of their San Francisco Bay area bike share experience, the BABS (Bay Area Bike Share) map is the ticket…Industry stakeholders and planners can also make use of BABS data to predict demand and model bike-share user behavior, hopefully resulting in a smoother, more efficient–and more profitable–experience for everyone.

View this complete post...

Interactive Map: Demolitions in Manhattan

Thursday, July 17th, 2014
Demolitions in Manhattan

In just a little over a decade Manhattan has seen hundreds of demolitions, from Wall Street to Inwood Heights. AddressReport’s interactive map plays an animation to visualize each and every demolition that took place since 2003.

View this complete post...

Interactive Map: Roadwork in Massachusetts

Wednesday, June 11th, 2014
massDOT Roadwork map

A new interactive map from massDOT pinpoints traffic incidents and scheduled road work throughout the state of Massachusetts. In addition to its useful information, another fascinating aspect of the roadwork map is the sheer volume of projects it shows taking place simultaneously. With everything from bridge inspection to highway paving on the daily docket, it’s clear why road maintenance is more than a full-time job.

View this complete post...

Interactive Map: The Chicago Commute

Thursday, February 6th, 2014
Transitized: Chicago Commute

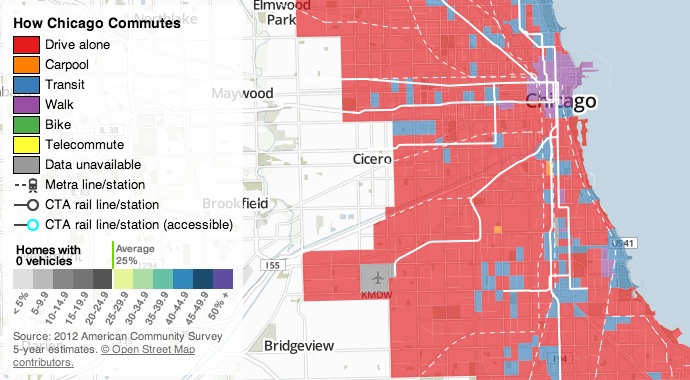
A unique interactive map from Transitized illustrates the various modes of transportation used by Chicagoans in their daily commutes.

You’ll see a lot of red on the map, symbolizing the carbon-conscious citizen’s nightmare of “driving alone,” but the outlook’s not all so bleak–most downtown neighborhoods favor walking, and some transit corridors with direct access to downtown (though not all, surprisingly) bring a majority of residents to work. Biking and carpooling are all but invisible at first, but mouseover any area of the map and you’ll see quick stats for that exact spot, revealing that lesser-utilized modes of transportation are still present in significant–if not majority–numbers.

View this complete post...

Interactive Map: Average Household Carbon Footprints

Thursday, January 16th, 2014
CoolClimate Interactive Map1

Keep an eye on your area’s carbon consumption and compare it to the rest of the country with these new interactive maps from UC Berkeley. Linked to their CoolClimate Carbon Footprint Calculator, this new tool visualizes the nation’s carbon consumption in a fresh way and invites new comparisons–pit the East Coast against the West, mountains again valleys or cities against suburbs. Additional maps break down carbon usage into household energy and transportation.

View this complete post...

Interactive Map: EV Charging Stations From Coast to Coast

Friday, October 18th, 2013
PlugShare - Interactive Map of EV Charging Stations

Worried that there’s not enough charging infrastructure to keep your EV going? PlugShare’s user-updated, interactive map serves a dual purpose: to help drivers plan their trips by locating residential and commercial charging stations, and to help us improve our EV infra by serving as a visual guide to where more stations are needed. A quick glance at the map establishes the Pacific Northwest and the Midwest as EV hotspots, while trips around non-mainland states or rural plains states like Wyoming and Montana would still be best accomplished in an old-fashioned gas-guzzler.

View this complete post...

Interactive Map: Save Our Bridges

Tuesday, October 16th, 2012

SAVE OUR BRIDGES
By accessing the Save Our Bridges Map, users can enter a zip code to immediately see the dangerous bridges in their area. Families can see if their children’s school buses or their own commutes to work or church take them across a bridge that is both structurally deficient and fracture critical. Trucking companies and other suppliers can determine whether the routes their carriers take require that they cross these dangerous bridges.

View this complete post...

Follow InfraUSA on Twitter Facebook YouTube Flickr

CATEGORIES


Show us your infra! Show us your infra!

Video, stills and tales. Share images of the Infra in your community that demands attention. Post your ideas about national Infra issues. Go ahead. Show Us Your Infra!  Upload and instantly share your message.

Polls Polls

Is the administration moving fast enough on Infra issues? Are Americans prepared to pay more taxes for repairs? Should job creation be the guiding determination? Vote now!

Views

What do the experts think? This is where the nation's public policy organizations, trade associations and think tanks weigh in with analysis on Infra issues. Tell them what you think.  Ask questions.  Share a different view.

Blog

The Infra Blog offers cutting edge perspective on a broad spectrum of Infra topics. Frequent updates and provocative posts highlight hot button topics -- essential ingredients of a national Infra dialogue.


Dear Friends,


It is encouraging to finally see clear signs of federal action to support a comprehensive US infrastructure investment plan.


Now more than ever, our advocacy is needed to keep stakeholders informed and connected, and to hold politicians to their promises to finally fix our nation’s ailing infrastructure.


We have already engaged nearly 280,000 users, and hoping to add many more as interest continues to grow.


We require your support in order to rise to this occasion, to make the most of this opportunity. Please consider making a tax-deductible donation to InfrastructureUSA.org.


Steve Anderson

Managing Director


SteveAnderson@InfrastructureUSA.org

917-940-7125

InfrastructureUSA: Citizen Dialogue About Civil Infrastructure