


REASON FOUNDATION
Executive Summary
This report compares the cost and environmental impact of passenger trips taken on scheduled Amtrak trains to trips taken to the same destinations on existing scheduled intercity motorcoaches.
Amtrak currently operates over 300 trains per day on 43 different routes. These routes connect more than 500 cities and towns in 46 of the 48 lower continental United States. Approximately 36% of all Amtrak passengers are carried on the Northeast Corridor, between Boston, New York, and Washington DC, both on the Acela and on Northeast Corridor regional trains. In addition to Northeast Corridor trains, Amtrak operates both short-corridor trains that generally operate within a single state or within only a few adjoining states (27 routes), and long-distance trains than span the country, primarily from east to west (14 routes).
By comparison there are currently an estimated 4,088 companies that operate motorcoaches in the U.S. Almost 20% of these companies operate daily, scheduled intercity service between various city pairs in all 48 of the lower 48 states. This scheduled intercity service is operated primarily by the large national carriers – Greyhound and Coach USA – but also by smaller local and regional companies. More than 16,000 motorcoaches operate regularly in fixed-route service in the U.S. and almost half of all annual motorcoach miles are operated on scheduled, fixed routes.
There are currently bus stations with some scheduled intercity service in 2,766 U.S. cities and towns. There are less than 150 counties, parishes, or independent cities in the U.S. that are not currently served by some type of scheduled intercity service. See Figure 1 for a map of this scheduled intercity Amtrak and bus service.
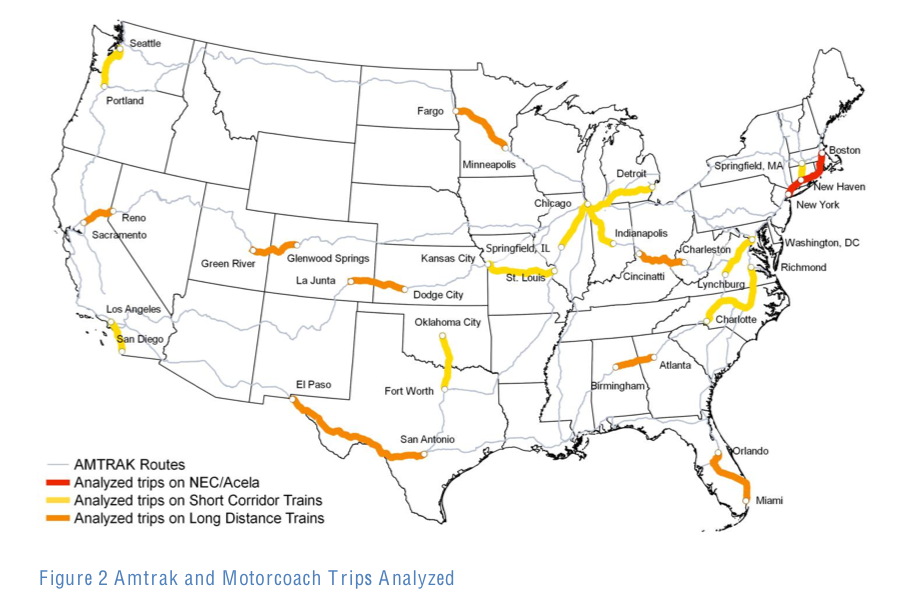
For this analysis the authors analyzed twenty specific trips between select city pairs in the continental United States. The specific trips that were analyzed are shown in Figure 2. Most of the analyzed trips are approximately 200 miles in length, but several are shorter and several are as long as 600 miles. The specific trips included in the analysis were chosen to provide representative geographic coverage of the lower 48 states, urban and rural trips, Amtrak trips on the Northeast Corridor, as well as short-corridor and long-distance Amtrak trains.
In addition, trips were specifically chosen on those Amtrak corridors that are the most and least profitable on an operating basis, according to Amtrak financial data. All of the trips can be taken on a single Amtrak train or a single scheduled bus, with no transfers required for either mode.
The amount of service available for each of these twenty trips varies widely – from only one scheduled train or bus per day each way – between Dodge City Kansas and La Junta Colorado – to more than 35 trains or buses per day each way between Boston and New York City. In general the bus provides more schedule options than the train; for only one of the twenty trips are there more scheduled trains per week than buses (Chicago, IL – Springfield, IL). For half of the trips there are more than twice as many scheduled buses per week as trains.
The average speed on the route also varies significantly for both the train and the bus; for ten of the twenty trips total average travel time is less when taking the train, while for the other ten trips total average travel time is less when taking the bus. The difference in total travel time between modes is often small; for half of the trips the difference is less than one hour. The greatest differences are for the trips from Sacramento, CA to Reno, NV (bus travel time is 2.9 hours less) and from Cincinnati, OH to Charleston, WV (bus travel time is 3.7 hours longer).
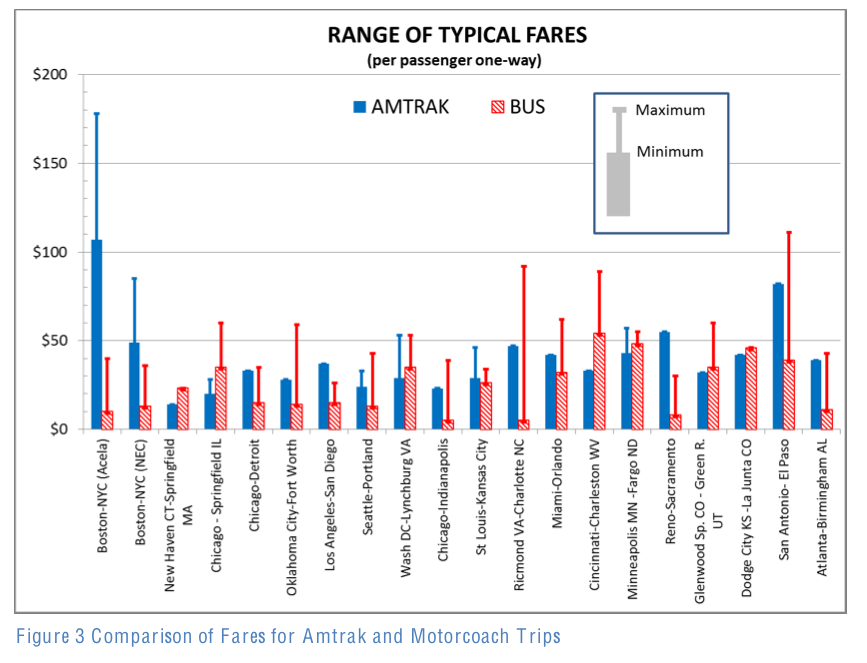
See Figure 3 for a comparison of “typical” fares for each trip, based on data from the relevant carrier’s website. All fares shown are for travel with at least one week advanced purchase; for both the train and bus fares are higher on most routes if tickets are purchased with less advanced notice. For some routes there are a range of fares shown – in many cases discounts are available for on-line purchase and/or fares vary by time of day departure.
Read full report (PDF) here: Supporting Passenger Mobility and Choice
About Reason Foundation
reason.org
“Reason Foundation advances a free society by developing, applying, and promoting libertarian principles, including individual liberty, free markets, and the rule of law. Reason Foundation produces respected public policy research on a variety of issues and publishes the critically-acclaimed Reason magazine. Together, our top-tier think tank and political and cultural magazine reach a diverse, influential audience, advancing the values of choice, individual freedom and limited government.”
Tags: Amtrak, Buses, price comparison, Reason Foundation, Supporting Passenger Mobility and Choice, train
 RSS Feed