


FEDERAL HIGHWAY ADMINISTRATION (FHWA)
FEDERAL TRANSIT ADMINISTRATION (FTA)
This edition of the C&P report is based primarily on data through the year 2010; consequently, the system conditions and performance measures presented should reflect effects of the Safe, Accountable, Flexible, Efficient Transportation Equity Act: A Legacy for Users (SAFETEA-LU), which authorized Federal highway and transit funding for Federal fiscal years 2005 through 2009 (and extended through fiscal year 2012), as well as some of the impact of the funding authorized under the American Recovery and Reinvestment Act of 2009 (Recovery Act). None of the impact of funding authorized under the Moving Ahead for Progress in the 21st Century Act (MAP-21) is reflected. In assessing recent trends, this report generally focuses on the 10- year period from 2000 to 2010. The prospective analyses generally cover the 20-year period ending in 2030; the investment levels associated with these scenarios are stated in constant 2010 dollars.
In 2010, all levels of government spent a combined $205.3 billion for highway-related purposes, of which $11.9 billion was a direct impact of the Recovery Act. All levels of government spent a combined $54.3 billion for transit-related purposes, including $2.4 billion of expenditures supported by one-time funding under the Recovery Act.
The average annual capital investment level needed to maintain the conditions and performance of highways and bridges at 2010 levels through the year 2030 is projected to range from $65.3 billion to $86.3 billion per year, depending on the future rate of growth in vehicle miles traveled (VMT). Improving the conditions and performance of highways and bridges by implementing all cost-beneficial investments would cost an estimated $123.7 billion to $145.9 billion per year. (Note that these projections are much lower than those presented in the 2010 C&P report, driven in part by an 18 percent reduction in highway construction prices between 2008 and 2010). In 2010, all levels of government spent a combined $100.2 billion for capital improvements to highways and bridges.
Bringing existing transit assets up to a state of good repair would require an annualized investment level of $18.5 billion through the year 2030. The estimated combined costs associated with accommodating future increases in transit ridership and addressing system preservation needs when it is cost-beneficial to do so, would range from $22.0 billion to $24.5 billion per year. In 2010, all levels of government spent a combined $16.5 billion for transit capital improvements.
Highlights: Highways and Bridges
Extent of the System
- The Nation’s road network includes more than 4,083,768 miles of public roadways and more than 604,493 bridges. In 2010, this network carried almost 2.985 trillion vehicle miles traveled (VMT).
- The 1,007,777 miles of Federal-aid highways (25 percent of total mileage) carried 2.525 trillion VMT (85 percent of total travel) in 2010.
- While the 162,698 miles on the National Highway System (NHS) make up only 4 percent of total mileage, the NHS carried 1.305 trillion VMT in 2010, just under 44 percent of total travel.
- The 47,182 miles on the Interstate System carried 0.731 trillion VMT in 2010, constituting a bit over 1 percent of mileage and just over 24 percent of total VMT.
Spending on the System
- All levels of government spent a combined $205.3 billion for highway-related purposes in 2010. About half of total highway spending ($100.2 billion) was for capital improvements to highways and bridges; the remainder included expenditures for physical maintenance, highway and traffic services, administration, highway safety, and debt service.
- In nominal dollar terms, highway spending increased by 67.3 percent between 2000 and 2010; adjusting for inflation this equates to a 35.9 percent increase. Highway capital expenditures increased by 63.4 percent between 2000 and 2010, equaling a 36.6 percent increase when adjusted for inflation.
- The portion of total highway capital spending funded by the Federal government increased from 42.6 percent in 2000 to 44.3 percent in 2010. The average annual increase in Federally funded highway capital outlay grew by 5.4 percent per year over this period, compared to a 4.7 annual increase in capital spending funded by State and local governments.
- The composition of highway capital spending shifted from 2000 to 2010, particularly from 2008 to 2010, which was partially attributable to the Recovery Act. The percentage of highway capital spending directed toward system rehabilitation rose from 52.7 percent in 2000 to 59.9 percent in 2010. Over the same period, the percentage directed toward system enhancement rose from 9.9 percent to 12.8 percent, while the percentage directed toward system expansion fell from 37.4 percent to 27.4 percent.
Conditions and Performance of the System
- Work is under way to establish metrics and data collection systems to capture information on attaining sustainable transportation systems, both in terms of fostering livable communities and advancing environmental sustainability
Highway Safety Has Improved
- The annual number of highway fatalities was reduced by 21.6 percent between 2000 and 2010, dropping from 41,945 to 32,885. The fatality rate per 100 million VMT declined from 1.53 in 2000 to 1.11 in 2010.
- Between 2000 and 2010, the number of pedestrians killed by motor vehicle crashes decreased by 10.1 percent, from 4,763 to 4,282, and the number of pedalcyclists (such as bicyclists) killed has decreased almost 10.8 percent, from 693 to 618. While these are positive trends, they also reflect that less progress has been made in reducing nonmotorist fatalities than in reducing overall highway fatalities.
- The number of traffic-related injuries decreased by almost 32 percent from 3.1 million to 2.1 million between 2000 and 2010. The injury rate per 100 million VMT declined from 112 in 2000 to 71 in 2010.
Pavement Conditions Have Improved in Many Areas
- The percentage of VMT on NHS pavements with “good” ride quality rose from 48 percent in 2000 to 60 percent in 2010. The share of VMT on NHS pavements with “acceptable” ride quality increased from 91 percent to 93 percent.
- The percentage of Federal-aid Highway VMT on pavements with “good” ride quality rose from 42.8 percent in 2000 to 50.6 percent in 2010, while the share of VMT on pavements with “acceptable” or better ride quality declined from 85.5 percent to 82.0 percent.
- The percentage of Federal-aid Highway VMT on pavements with “good” ride quality rose from 42.8 percent in 2000 to 50.6 percent in 2010, while the share of VMT on pavements with “acceptable” or better ride quality declined from 85.5 percent to 82.0 percent.many transportation agencies leading them to move away from a simple strategy of addressing assets on a “worst first” basis toward more comprehensive strategies aimed at targeting investment where it will benefit the most users.
Bridge Conditions Have Improved
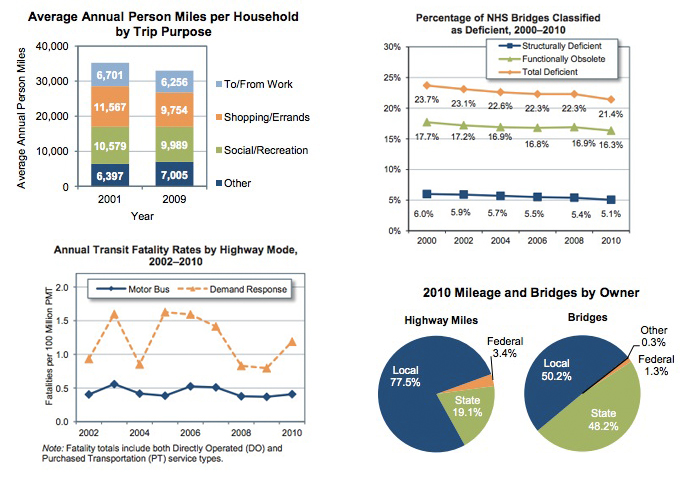
- Based directly on bridge counts, the share of NHS bridges classified as structurally deficient declined from 6.0 percent in 2000 to 5.1 percent in 2010. Over this period, the share classified as functionally obsolete declined from 17.7 percent to 16.3 percent, so the total share classified as deficient declined from 23.7 percent to 21.4 percent.
- Weighted by deck area, the share of NHS bridges classified as structurally deficient declined from 8.7 percent in 2000 to 8.3 percent in 2010. Over this period, the share classified as functionally obsolete declined from 22.0 percent to 20.3 percent, so the total share classified as deficient declined from 30.7 percent to 28.7 percent.
- Systemwide, based on bridge counts, the share of bridges classified as structurally deficient declined from 15.2 percent to 11.7 percent from 2000 to 2010, the functionally obsolete share declined from 15.5 percent to 14.2 percent, and the total percentage of deficient bridges declined from 30.7 percent to 25.9 percent.
- The reductions in bridge deficiencies have not been uniform across the system. The share of rural interstate bridges classified as structurally deficient rose from 4.0 percent in 2000 to 4.5 percent in 2010; over the same period, the share of urban collector bridges classified as functionally obsolete was not reduced below the 2000 level of 28.1 percent.
Download full version (PDF): Status of the Nation’s Highways, Bridges, and Transit
About the Federal Highway Administration
www.fhwa.dot.gov
“The Federal Highway Administration (FHWA) provides stewardship over the construction, maintenance and preservation of the Nation’s highways, bridges and tunnels. FHWA also conducts research and provides technical assistance to state and local agencies in an effort to improve safety, mobility, and livability, and to encourage innovation.”
About the Federal Transit Administration
www.fta.dot.gov
“The Federal Transit Administration (FTA) is an agency within the United States Department of Transportation (DOT) that provides financial and technical assistance to local public transit systems. The FTA is one of ten modal administrations within the DOT. Headed by an Administrator who is appointed by the President of the United States, the FTA functions through a Washington, D.C., headquarters office and ten regional offices which assist transit agencies in all states, the District of Columbia, and the territories. Until 1991, it was known as the Urban Mass Transportation Administration (UMTA).”
Tags: Federal Highway Administration, Federal Transit Administration, FHWA, FTA, United States Department of Transportation, USDOT
 RSS Feed