


BUREAU OF TRANSPORTATION STATISTICS
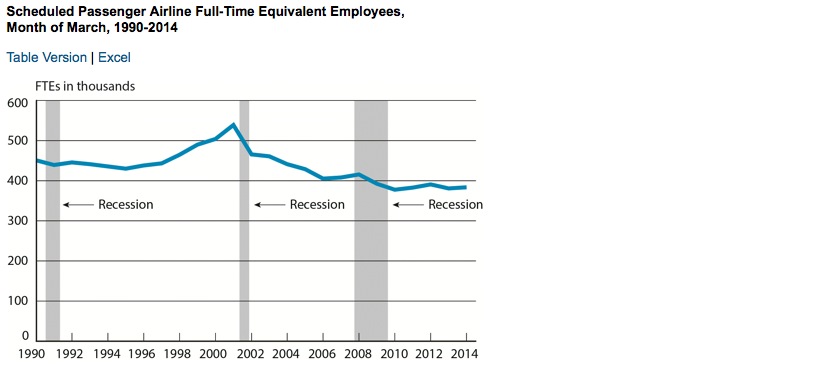
U.S. scheduled passenger airlines employed 383,610 workers in March 2014, 0.8 percent more than in March 2013, the U.S. Department of Transportation’s Bureau of Transportation Statistics (BTS) reported today. March was the fourth consecutive month that full-time equivalent (FTE) employment for U.S. scheduled passenger carriers was higher than the same month of the previous year (Tables 1, 2, 3).
The March 2014 FTE total for scheduled passenger carriers was 3,070 more than in March 2013 and the highest monthly total since October 2012 (Table 3). Scheduled passenger airline categories include network, low-cost, regional and other airlines. Historical employment data can be found on the BTS web site.
The five network airlines that collectively employ two-thirds of the scheduled passenger airline FTEs reported 0.6 percent more FTEs in March 2014 than in March 2013 (Table 7). US Airways, Alaska Airlines, Delta Air Lines and American Airlines increased FTEs from March 2013 while United Airlines reduced FTEs (Table 9). Network airlines operate a significant portion of their flights using at least one hub where connections are made for flights to down-line destinations or spoke cities.
Of the six low-cost carriers, four – Allegiant Airlines, Spirit Airlines, JetBlue Airways and Virgin America – reported an increase in FTEs from March 2013 while two – Frontier Airlines and Southwest Airlines – reported a decline (Table 12). Low-cost airlines operate under a low-cost business model, with infrastructure and aircraft operating costs below the overall industry average.
Among the 13 regional carriers, four carriers reported reduced employment levels in March compared to the previous year: Endeavor Airlines, Chautauqua Airlines, American Eagle Airlines and Shuttle America. The others reported increases (Table 15). Regional carriers typically provide service from small cities, using primarily regional jets to support the network carriers’ hub and spoke systems.
Carrier Groups: The five network airlines employed 66.8 percent of the total number of FTEs employed by all scheduled passenger airlines in March, the six low-cost carriers employed 18.3 percent and the 13 regional carriers employed 13.2 percent (Table 4). The three airlines with the most FTEs in March – United, Delta and American – employed 56.1 percent of the month’s total passenger airline FTEs (Tables 3, 6). These three airlines carried 40.1 percent of total passengers traveling on U.S. airlines in February, the most recent month available. See Air Traffic press releases.
Top employers by group: United employed the most FTEs (80,694) in March among the network airlines, Southwest employed the most FTEs (45,163) among low-cost airlines, and American Eagle employed the most FTEs (10,865) among regional airlines. Four of the top five employers in the industry are network airlines (Table 6).
Airline Mergers: Airlines that announce mergers typically begin joint reporting following U.S. Department of Transportation approval and issuance of a single economic certificate. Southwest and AirTran Airways began joint reporting of their financial data, including employment numbers, in April 2012 under a waiver granted by the Department, while reporting the rest of their data as separate carriers. American and US Airways, following their December 2013 merger announcement, will report separately until the Department approves single carrier reporting and a single economic certificate is issued.
In March 2014 (for January 2014 data), the Department began displaying combined on-time performance data, mishandled baggage data, oversales data and complaint data in its Air Travel Consumer Report for Southwest and Air Tran as well as for American and U.S. Airways because both sets of airlines are sufficiently integrated that consumers perceive them as a single airline. The Air Travel Consumer Report also continues to display the separate performance of each of these airlines and will continue to do so until a single economic certificate is issued.
Download full version (PDF): March 2014 Passenger Airline Employment Data
About the Bureau of Transportation Statistics
www.rita.gov/bts
The Bureau of Transportation Statistics (BTS) was established as a statistical agency in 1992. The Intermodal Surface Transportation Efficiency Act (ISTEA) of 1991 created BTS to administer data collection, analysis, and reporting and to ensure the most cost-effective use of transportation-monitoring resources. BTS brings a greater degree of coordination, comparability, and quality standards to transportation data, and facilitates in the closing of important data gaps.
Tags: Air travel, Airlines, BTS, Bureau of Transportation Statistics, Research and Innovative Technology Administration, RITA
 RSS Feed