


INTERNATIONAL RENEWABLE ENERGY AGENCY (IRENA)
Renewable Energy and Jobs: Annual Review 2018
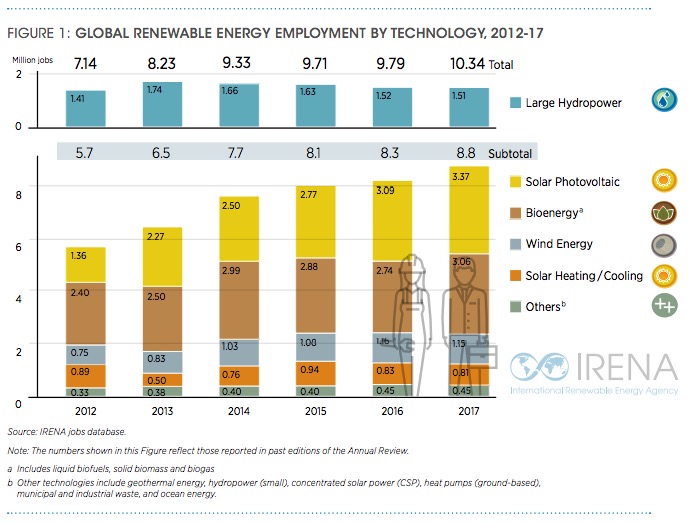
The renewable energy sector, including large hydropower, employed 10.3 million people, directly and indirectly, in 2017 . This represents an increase of 5.3% over the number reported the previous year.
Renewable energy employment worldwide has continued to grow since IRENA’s first annual assessment in 2012. During 2017, the strongest expansion took place in the solar photovoltaic (PV) and bioenergy industries. In contrast, jobs in wind energy and in solar heating and cooling declined, while those in the remaining technologies were relatively stable (Figure 1).
Employment trends and patterns are shaped by a wide range of technical, economic and policy-driven factors. The falling costs of renewable energy technologies continue to spur the deployment of renewables, and during 2017, total investments edged up over 2016. Job creation dynamics are subject to geographic shifts in the production and installation of renewable energy equipment. Corporate strategies and industry realignments are important factors in this context, as portions of the supply chain become more globalised and geographically differentiated.
Governmental policy, including the degree of commitment to transforming the energy sector, is also a key factor (IRENA, IEA and REN21, 2018). Policy encompasses mandates, regulations and market design in support of deployment, as well as industrial policies to create and strengthen domestic value creation. Where policies become less favourable to renewable energy, change abruptly or invite uncertainty, the result can be job losses or lack of new job creation. On the other hand, expectations of adverse policy changes can lead project developers to push forward a portfolio of projects that would otherwise be initiated later, in order to beat a certain cut-off date. The result in such cases is a temporary surge of activity and employment creation, followed by a drop. In the United States, for instance, the expected imposition of tariffs on solar PV panel imports led to larger deployments in 2016 but a slower pace during 2017.
Labour productivity has grown in importance as renewable energy technologies have matured, processes have been automated, and economies of scale and learning effects have risen. As previous editions of this Review have pointed out, bioenergy feedstock harvesting is subject to growing mechanisation in some countries. Automation of solar PV panel manufacturing is already well advanced.
This fifth edition of Renewable Energy and Jobs – Annual Review provides the latest available estimates and calculations on renewable employment. It represents an ongoing effort to refine the data, including IRENA’s own methodology. Global numbers are based on a wide range of studies with varying methodologies and uneven detail and quality.
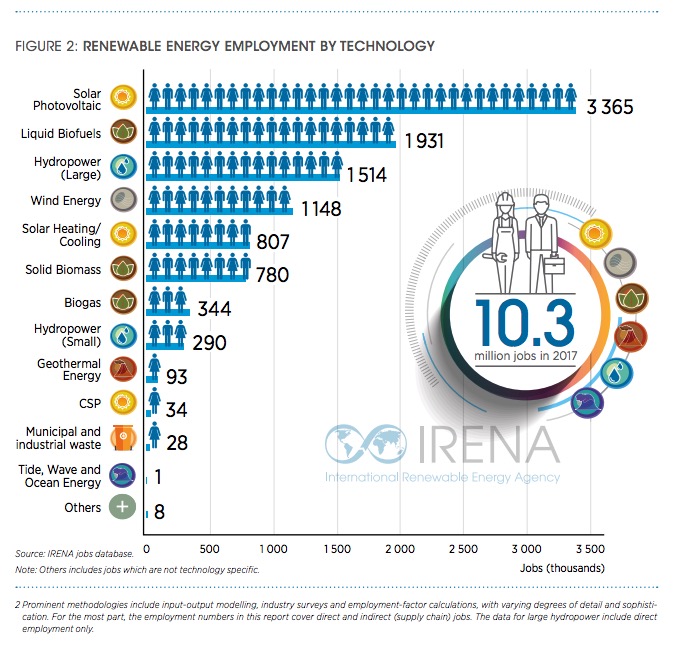
The first section highlights employment trends by technology (Figure 2). It discusses employment in solar PV, liquid biofuels, wind, solar heating and cooling, and large hydropower (Box 1). For other technologies which employ far fewer people, less information is available. The second section offers insights for selected countries. In addition, gender aspects (Box 2) and off-grid developments (Box 3) are discussed.
Renewable Energy Employment by Technology
Solar Photovoltaics
Globally, the solar PV industry had another banner year, with record installations of 94 gigawatts (GW) during 2017, up from 73 GW in 2016, and significant new job creation. China, India, the United States and Japan were the most important markets, followed by Turkey, Germany, Australia and the Republic of Korea (IRENA, 2018b). Employment increased by 8.7% to approach 3.37 million jobs in 2017.
A key feature of the solar PV landscape is that jobs remain highly concentrated in a small number of countries. This can be attributed to the fact that the bulk of manufacturing takes place in relatively few countries and domestic markets vary enormously in size. The top five countries, led by China, account for 90% of solar PV jobs worldwide. Of the leaders shown in Figure 3, eight are Asian. Overall, Asia is home to almost 3 million solar PV jobs. This represents 88% of the global total, followed by North America’s 7% share and Europe’s 3%.
Reflecting its unchallenged status as the leading producer of PV equipment and the world’s largest installation market, China accounted for about two-thirds of PV employment worldwide, or some 2.2 million jobs. Job gains were once again strongest in the installations segment, which now accounts for 36% of China’s PV jobs (CNREC, 2018). Likewise, strong growth in new capacity additions boosted employment in India to an estimated 164 000 jobs.
By contrast, European PV employment continued its downward slide, reflecting limited domestic installation markets and a lack of competitiveness among European module manufacturers. Revised estimates indicate an 8% decrease to 99 600 jobs across the European Union in 20164 (EurObserv’ER, 2018). More surprisingly, US employment fell as well, for the first time, to about 233 000 jobs (Solar Foundation, 2018). Japan’s slowing pace caused employment to fall from 302 000 in 2016 to an estimated 272 000 jobs in 2017.
As deployment of solar PV continues to expand, more and more countries will benefit from job creation along the supply chain, primarily in installations and operations and maintenance (O&M) (IRENA, 2017b).
Liquid Biofuels
With the exception of Brazil, all major bioethanol producers were estimated to have reached new output peaks in 2017. Biodiesel production also rose in many of these countries, but remained somewhat below previous levels in Argentina, Indonesia and the Philippines, and at much lower levels in China6. Worldwide employment in biofuels is estimated at 1.93 million, a change of 12%. Most of these jobs are generated in the agricultural value chain (in planting and harvesting of feedstock).
The construction of fuel-processing facilities and O&M of existing plants employ fewer people, but typically require higher skills and offer better pay.
It should be noted that changes in biofuels employment do not necessarily equate to net job gains or losses. Oil palm, soybean and similar types of feedstock are used for a range of agricultural and commercial purposes in addition to the energy sector, and the composition of end-use demand is relatively fluid.
The regional profile of biofuels employment differs considerably from that of the solar PV sector. Latin America accounts for half the jobs worldwide, whereas Asia (principally labour-intensive Southeast Asian feedstock supply activities) accounts for 21%, North America for 16% and Europe for 10%. Figure 4 includes the dozen countries with at least 10 000 jobs and shows that the top 5 alone account for about 80% of global estimated employment.
Brazil continued to have the largest liquid biofuel workforce. The estimated 795 000 jobs indicate a small increase from the previous year. Employment also rose in the United States, buoyed by record production of ethanol and biodiesel (Urbanchuk, 2018). Biofuel output and employment also expanded in the European Union, which had an estimated 200 000 jobs in 2016 (EurObserv’ER, 2018).
Indonesia’s biofuels production has experienced a roller-coaster in recent years, impacted by changing export demand. Production in 2017 fell again, though not as dramatically as in 2015 (USDA-FAS, 2017a). Based on its employment-factor approach, IRENA estimates that close to 180 000 people worked in Indonesia’s biodiesel sector in 2017, a 22% decline from the previous year7 . Biofuel output reached new peaks during 2017 in Malaysia and Thailand. IRENA estimates that these two countries together employed some 133 000 people, with most of the jobs in feedstock supply.
Colombia is another important and labour-intensive Latin American biofuel producer. Its output in 2017 rose to a high of about 1 billion litres in 2017 (USDAFAS, 2017b). Estimates based on data published by Federación Nacional de Biocombustibles de Colombia (FNBC, n.d.) suggest the number could have been as high as 190 800 jobs in 2017, but it is unclear whether these represent full-time equivalents.
Wind
Including its onshore and offshore segments, the wind industry employs 1.15 million people worldwide, a 0.6% decrease from 2016. Most wind jobs are found in a small number of countries, although the degree of concentration is lower than in the solar PV sector. China alone accounts for 44% of global wind employment. The top five countries represent 76% of the total. The regional picture is also somewhat more balanced than in the solar PV industry. Asia’s 610 000 wind jobs make up about half the total, while Europe accounts for 30% and North America 10%. Of the top 16 countries shown in Figure 5, seven are European, four are Asian, three are from North America and one each is from Africa and South America.
China retained its undisputed lead in both new and cumulative installations during 2017. While new wind installations decreased 15%, those in the job-intensive offshore sector increased by 26%. The country’s total wind employment remained steady at 510 000 jobs (CNREC, 2018). Following China, five countries – Germany, the United States, India, the United Kingdom, and Brazil – together accounted for another 50% of global installations.
Wind employment in the United States edged up by 3% to a new high of 105 500 jobs in 2017 (AWEA, 2018). Brazil’s pace of installations remained roughly at the level of 2015, with employment estimated at 33 700 jobs.
Employment in Europe’s wind sector reached 344 000 jobs in 2016 (the year with the latest available data), representing a 10% increase over 2015. New wind installations amounted to 15.6 GW during 2017, up 25% from 2016. Some 12.5 GW added onshore and 3.2 GW offshore brought the continent’s cumulative total to 168.7 GW (Wind Europe, 2018b). Europe’s wind industry is a global technology leader, especially in the offshore segment, where it accounts for 88% of installed capacity worldwide.
Export markets hold considerable importance for sales and jobs; some European sites produce exclusively for export (Deloitte and Wind Europe, 2017).
Competition among manufacturers and service providers is intensifying internationally; requirements in some countries to source a certain share of equipment, components and services locally are reshaping the industry; and the supply chain is becoming more globalised. More than 80% of European wind firms have either a manufacturing or commercial presence in other parts of the world (Deloitte and Wind Europe, 2017). As a recent example, Danish turbine manufacturer Vestas announced in early 2018 plans to build a hub and nacelle assembly facility in Argentina, where it has sold its products since 1991 (Weston, 2018).
With a diversifying global supply chain, employment will be created in growing numbers of countries. IRENA’s work has documented the opportunity to create jobs along the supply chain (IRENA, 2017c, 2018c).
Download full version (PDF): Renewable Energy and Jobs Annual Review 2018
About the International Renewable Energy Laboratory
www.irena.org
The International Renewable Energy Agency (IRENA) is an intergovernmental organisation that supports countries in their transition to a sustainable energy future, and serves as the principal platform for international cooperation, a centre of excellence, and a repository of policy, technology, resource and financial knowledge on renewable energy. IRENA promotes the widespread adoption and sustainable use of all forms of renewable energy, including bioenergy, geothermal, hydropower, ocean, solar and wind energy in the pursuit of sustainable development, energy access, energy security and low-carbon economic growth and prosperity.
Tags: International Renewable Energy Agency, IRENA, Renewable Energy, Renewable Energy Jobs, Renewables
 RSS Feed