


UNITED STATES DEPARTMENT OF TRANSPORTATION
BUREAU OF TRANSPORTATION STATISTICS (BTS)
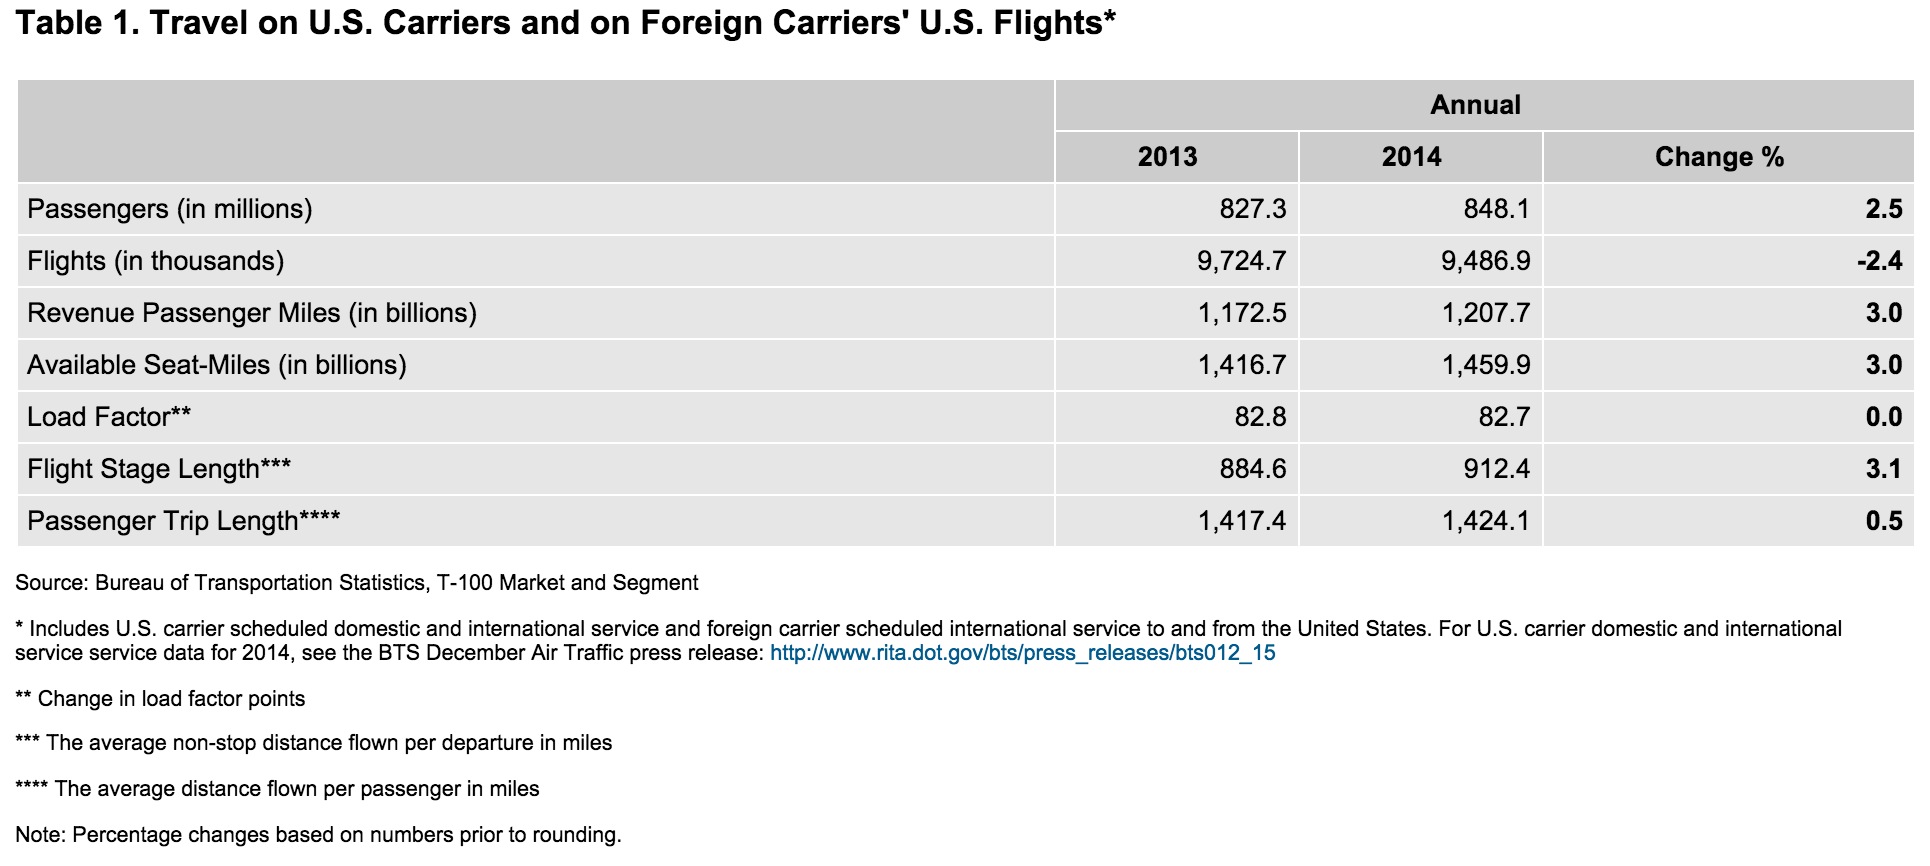
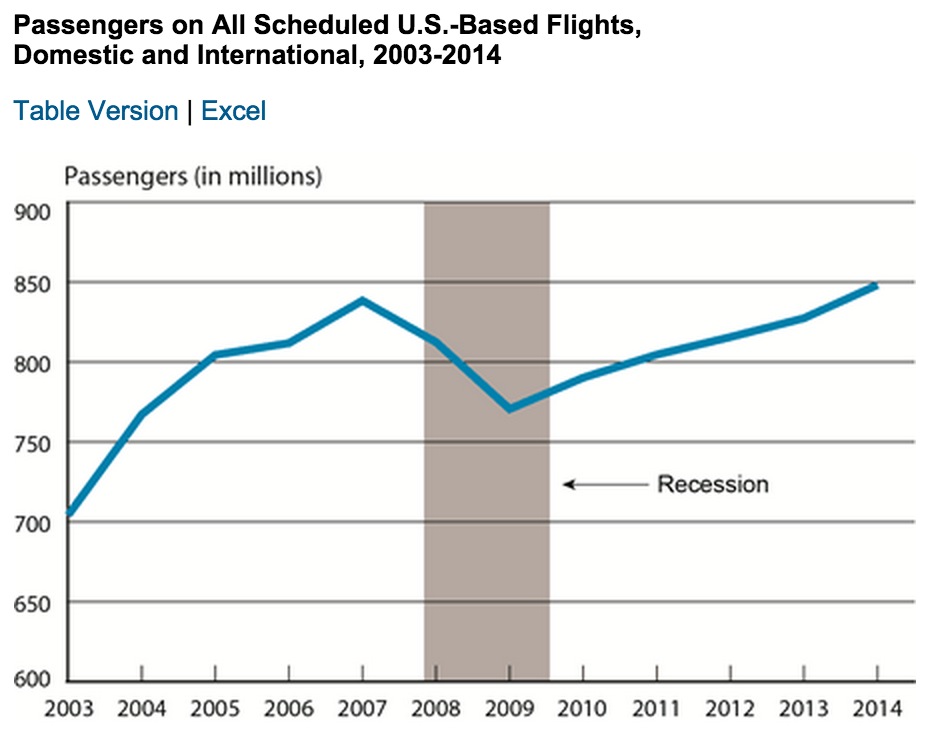 The U.S. Department of Transportation’s Bureau of Transportation Statistics (BTS) reported today that U.S. airlines and foreign airlines serving the United States carried an all-time high of 848.1 million systemwide (domestic and international) scheduled service passengers in 2014, 2.5 percent more than in 2013 and 1.2 percent more than the previous record-high of 838.4 million reached in 2007. The systemwide increase was the result of a 2.6 percent rise in the number of passengers on domestic flights (662.3 million) and 2.3 percent growth in passengers on U.S. and foreign airlines’ flights to and from the U.S. (185.8 million) (Tables 1, 1A, 5).
U.S. airlines carried 2.6 percent more passengers on domestic flights and 2.4 percent more passengers on international flights in 2014 than in 2013 for a systemwide increase of 2.6 percent. Foreign airlines carried 2.3 percent fewer passengers to and from the U.S. than in 2013. Despite the decline in travel on foreign airlines, the 185.8 million passengers on international flights to and from the U.S. was a record high, exceeding the previous high set in 2013 (Table 1A).
This annual release includes preliminary data on U.S. carrier scheduled domestic and international service, and foreign carrier scheduled international service to and from the United States. BTS regular monthly air traffic releases include data on U.S. carrier scheduled service only. For U.S. domestic service data for 2014, see the BTS December Air Traffic press release.
Trends
The 2.5 percent increase in total passengers from 2013 to 2014 was led by the domestic rise of 2.6 percent. The number of passengers on international flights rose 3.6 percent during the first 10 months of 2014 compared to the same period in 2013. In the last two months of 2014, the number declined 3.8 percent from 2013. For the entire year, the number of passengers on international flights increased 2.3 percent over 2013 (Tables 2, 6). For domestic numbers see Table 21 of BTS December Air Traffic press release.
Airlines with Most Passengers in 2014
Delta Air Lines carried more total system passengers in 2014 than any other U.S. airline for the fifth consecutive year. United Airlines carried more passengers on international flights to and from the U.S. in 2014 than any other U.S. or foreign carrier for the third consecutive year. British Airways carried the most passengers on flights to and from the U.S. of any foreign airline (Tables 3 and 7).
U.S. Airports with Most Passengers in 2014
More total system passengers boarded planes in 2014 at Atlanta Hartsfield-Jackson International than at any other U.S. airport. More passengers boarded international flights at New York John F. Kennedy than at any other U.S. airport (Tables 4 and 8).
Load Factor and Capacity
From 2013 to 2014, systemwide demand, measured in Revenue Passenger-Miles (RPMs) rose slightly less than capacity measured in Available Seat-Miles (ASMs). As a result, load factor declined in 2014 to 82.7 from 82.8 in 2013, which was the highest annual systemwide load factor on record for U.S. carriers and foreign carriers serving the United States (Table 1).
Demand on international flights, measured in RPMs, rose 3.1 percent in 2014, less than the 4.4 percent rise in capacity measured in ASMs. The result was a decline in the international load factor to 81.1 from 82.1 in 2013, which was the highest annual international load factor on record for U.S. carriers and foreign carriers serving the United States (Table 5). The international load factor decline from 2013 to 2014 produced the systemwide decline as U.S. airline domestic load factor reached an all-time high of 84.5 in 2014, exceeding the previous high of 83.5 set in 2013.
For annual airline and airport statistics, Tables 1 through 4 provide combined domestic and international travel statistics, and Tables 5 through 8 provide international travel statistics.
Download full version (PDF): Summary 2014 U.S.-Based Airline Traffic Data
About the U.S. DOT Bureau of Transportation Statistics
www.rita.dot.gov/bts/home
The Bureau of Transportation Statistics (BTS) was established as a statistical agency in 1992. The Intermodal Surface Transportation Efficiency Act (ISTEA)of 1991 created BTS to administer data collection, analysis, and reporting and to ensure the most cost-effective use of transportation-monitoring resources. BTS brings a greater degree of coordination, comparability, and quality standards to transportation data, and facilitates in the closing of important data gaps.
Tags: Air travel, Airlines, airports, BTS, Bureau of Transportation Statistics, RITA, U.S. DOT, United States Department of Transportation
 RSS Feed