


MINETA TRANSPORTATION INSTITUTE
Executive Summary
It is widely recognized that new vehicle and fuel technology is necessary, but not sufficient, to meet deep greenhouse gas (GHG) reductions goals for both the U.S. and the state of California. Demand management strategies (such as land use, transit, and auto pricing) are also needed to reduce passenger vehicle miles traveled (VMT) and related GHG emissions. In this study, the authors explore how demand management strategies may be combined with new vehicle technology (battery electric vehicles or BEVs) and services (dynamic ridesharing) to enhance VMT and GHG reductions. Most BEVs can travel only about 60 to 125 miles (97 to 201 km) before recharging. Dynamic ridesharing services automatically match drivers and riders with similar spatial and temporal constraints (e.g., Zimride, Carma, UberPool, and Lyft Line). Owning a BEV or using a dynamic ridesharing service may be more feasible when distances to destinations are made shorter and alternative modes of travel are provided by demand management strategies.
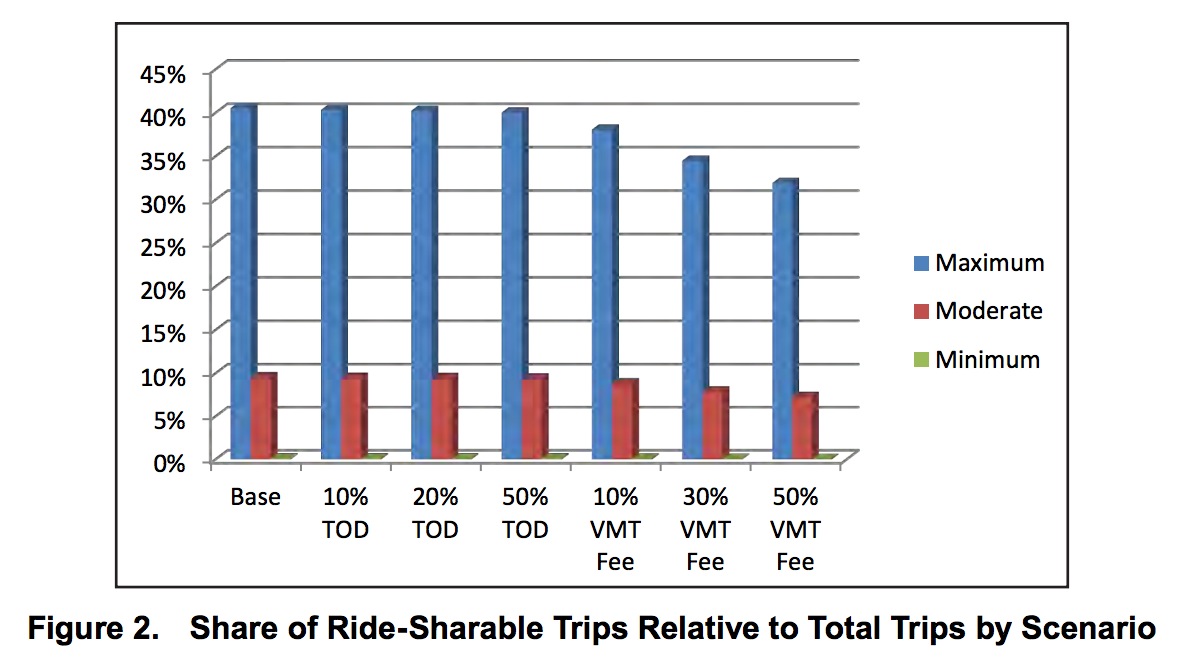
To examine potential markets for dynamic ridesharing and BEVs, the authors use the San Francisco Bay Area Metropolitan Transportation Commissions’ (MTC) activity-based microsimulation travel demand model (ABM) for the year 2010. A business-as-usual (Base Case), transit-oriented development (TOD), and auto pricing (VMT Fee) scenarios are simulated with and without high, medium, and low dynamic ridesharing participation levels and BEV driving ranges.
The results of this study suggest that dynamic ridesharing has the potential to significantly reduce VMT and related GHG emissions, which may be greater than land use and transit policies typically included in Sustainable Community Strategies (under California Senate Bill 375), if travelers are willing to pay with both time and money to use the dynamic ridesharing system. The combination of dynamic ridesharing with the TOD and VMT Fee scenarios suggests some policy combinations that may be more effective than dynamic ridesharing alone but perhaps more politically palatable. For example, a moderately used regional dynamic ridesharing with 10% increase in VMT fees may produce reductions in VMT on the order of 11% compared with a business-as-usual scenario in one horizon year. However, in general, large synergistic effects between ridesharing and transit-oriented development or auto pricing policies were not found in this study.
The results of the BEV simulations suggest that TODs may increase the market for BEVs by less than 1% in the San Francisco Bay Area and that auto pricing policies may increase the market by as much as 7%. However, it is possible that larger changes are possible over time in faster growing regions where development is currently at low density levels (for example, the Central Valley in California). The VMT Fee scenarios show larger increases in the potential market for BEV by as much as 7%.
…
Conclusions
This study uses the San Francisco Bay Area’s Metropolitan Transportation Commission (MTC) ABM to explore the potential reduction in VMT and related GHG emissions from a regional dynamic ridesharing system at different levels of use. The results of this study suggest that dynamic ridesharing has the potential to significantly reduce VMT and related GHG emissions, which may be greater than land use and transit measures typically included in Sustainable Community Strategies (under California Senate Bill 375), if travelers are willing to pay with both time and money to use the dynamic ridesharing system. The combination of dynamic ridesharing with the TOD and VMT Fee scenarios suggest some policy combinations that may be more effective than dynamic ridesharing alone but perhaps more politically palatable. For example, a moderately used regional dynamic ridesharing with 10% increase in VMT fees may produce reductions in VMT on the order 11% compared with a business-as-usual scenario in one horizon year. However, in general, large synergistic effects between ridesharing and transit-oriented development or auto pricing policies were not found in this study.
To gain insight into the potential effect of TOD and VMT Fees on the potential market for BEVs, the results of the Base, TOD, and VMT Fee scenarios were compared to understand the number of vehicles that travel within three BEV ranges (50, 75, and 100 miles, or 80, 120, and 160 km). The VMT fee scenarios showed the greatest potential for market growth, while the TOD scenario showed a small potential. Again, larger changes in the BEV market may be realized in faster growing regions that shift from low-density sprawling development to focused development around transit stations.
Future research should explore the factors associated with higher dynamic ridesharing and BEV use including individual attributes, characteristics of tours and trips, and time and cost benefits. In addition, the travel effects of dynamic ridesharing systems should be simulated explicitly, including auto ownership, mode choice, destination, and extra VMT for passenger pick-up.
About the Mineta Transportation Institute
transweb.sjsu.edu
The Mineta Transportation Institute (MTI) conducts research, education, and information and technology transfer, focusing on multimodal surface transportation policy and management issues. It was established by Congress in 1991 as part of the Intermodal Surface Transportation Efficiency Act (ISTEA) and was reauthorized under TEA-21 and again under SAFETEA-LU. The Institute is funded by Congress through the US Department of Transportation’s (DOT) Research and Innovative Technology Administration, by the California Legislature through the Department of Transportation (Caltrans), and by other public and private grants and donations, including grants from the US Department of Homeland Security.
Tags: Carma, Emissions, GHG, Lyft Line, Mineta Transportation Institute, Rideshare, Ridesharing, San Francisco, UberPool, VMT, Zimride
 RSS Feed