


UNITED STATES DEPARTMENT OF ENERGY
OFFICE OF ENERGY EFFICIENCY AND RENEWABLE ENERGY
Executive Summary
This report addresses the fundamental question of how much plug-in electric vehicle (PEV) charging infrastructure—also known as electric vehicle supply equipment (EVSE)—is needed in the United States to support both plug-in hybrid electric vehicles (PHEVs) and battery electric vehicles (BEVs). It complements ongoing EVSE initiatives by providing a comprehensive analysis of national PEV charging infrastructure requirements. The result is a quantitative estimate for a U.S. network of non-residential (public and workplace) EVSE that would be needed to support broader PEV adoption. The analysis provides guidance to public and private stakeholders who are seeking to provide nationwide charging coverage, improve the EVSE business case by maximizing station utilization, and promote effective use of private/public infrastructure investments.
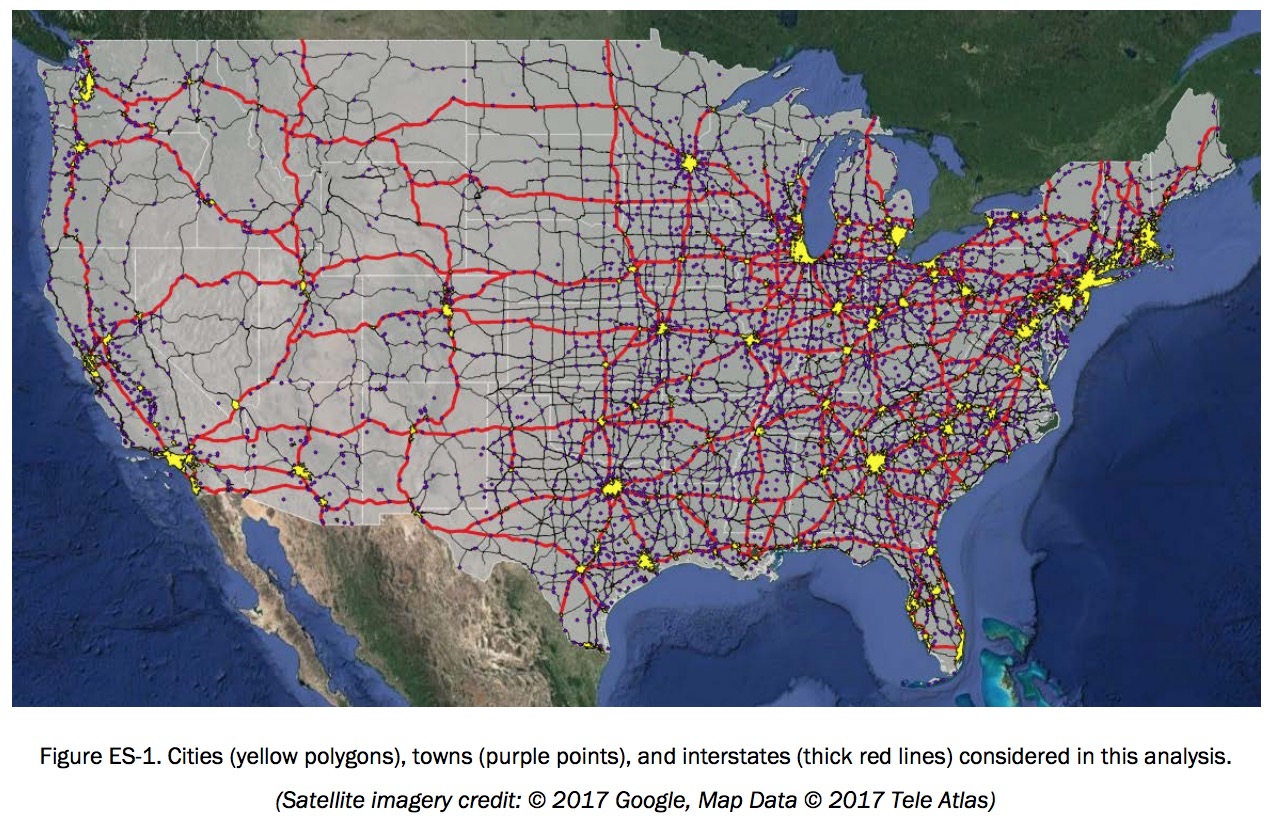
The analysis is organized around the non-residential EVSE network required to meet consumer coverage expectations and to satisfy consumer demand in high-PEV-adoption scenarios. Coverage and charging demand estimates needed to serve growing PEV markets are made for the communities where people live and the highway corridors on which they travel (Figure ES-1), including four specific geographic areas:
- Cities (486 Census Urban Areas, population greater than 50,000, 71% of U.S. population)
- Towns (3,087 Census Urban Clusters, population 2,500 to 50,000, 10% of U.S. population)
- Rural Areas (regions not covered by Census Urban Areas/Clusters, 19% of U.S. population)
- Interstate Highway System Corridors (28,530 miles of highway).
While this work is not intended to forecast future PEV markets, scenarios are developed to exercise the infrastructure estimation methodology and highlight sensitivities. The analysis assigns no probabilities to any PEV market or technology scenarios and considers none of the scenarios as most likely. However, a central scenario is established from which individual elements of the modeling framework are studied using parametric sensitivity analysis as shown in Table ES-1. The central scenario and bounds on the accompanying sensitivities have been developed using a combination of existing PEV market/technology data and engineering judgement to represent a set of scenarios that are illustrative of the role that key variables play in dictating PEV infrastructure requirements. The goal of this scenario development is to estimate the magnitude of electric vehicle infrastructure requirements (relative to a growing national fleet of PEVs) and to highlight dependencies with consumer preferences and technology development.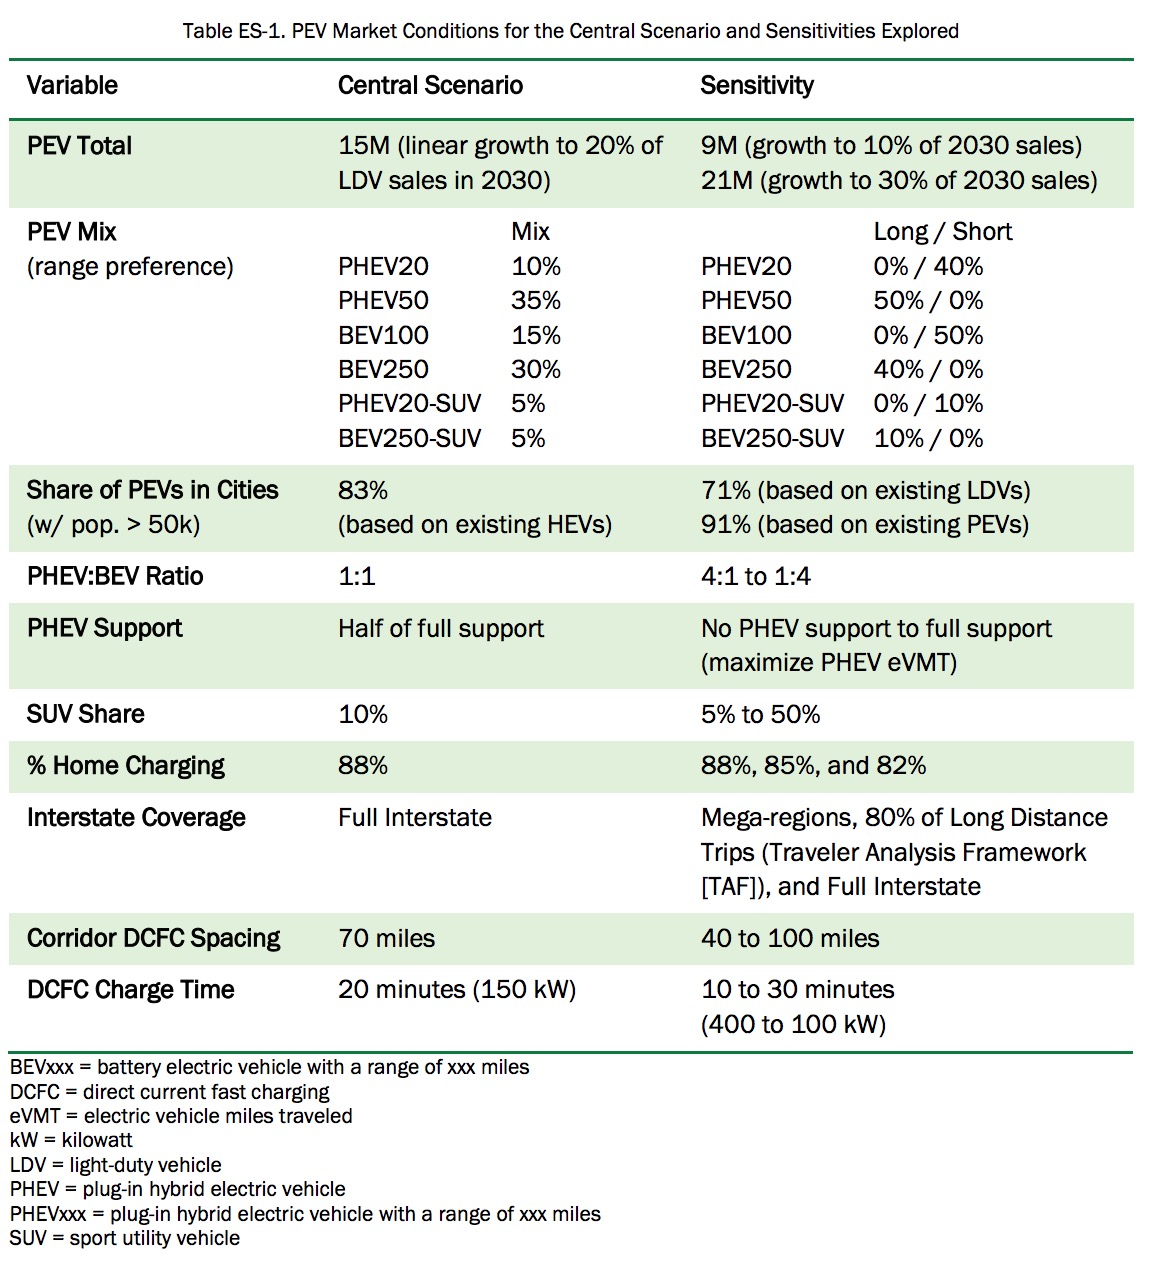
The analysis relies on advanced PEV simulations using millions of miles of real-world daily driving schedules sourced from large public and commercial travel data sets. Technical considerations are made for the spatial density of PEVs concentrated in cities and towns, ambient temperature effects on electric driving range, and frequency of long distance driving days requiring non-residential EVSE. Simulations are rooted in a set of foundational assumptions which are applied across all scenarios. For example, consumers are simulated in all scenarios as preferring to perform the majority of charging at their home location. This assumption produces simulation results in the central scenario where 88% of PEV charging takes place at home locations (due to the large amount of time vehicles are parked at home and relatively short typical daily driving distances), consistent with early market findings in the EV Project. Charging at non-residential stations is simulated on an as-necessary basis such that consumers are able to maximize electric vehicle miles traveled (eVMT).
Additionally, it is assumed that future PEVs will be driven in a manner consistent with present day gasoline vehicles (e.g., 70% of daily driving under 40 miles and 95% under 100 miles). While impacts of transportation network companies (e.g., Uber, Lyft) and advances in automated driving technology are not considered in this analysis, interactions between evolving mobility patterns and refueling infrastructure supporting advanced vehicles are currently being investigated by the consortium of national laboratories participating in the U.S. Department of Energy’s SMART Mobility Initiative.
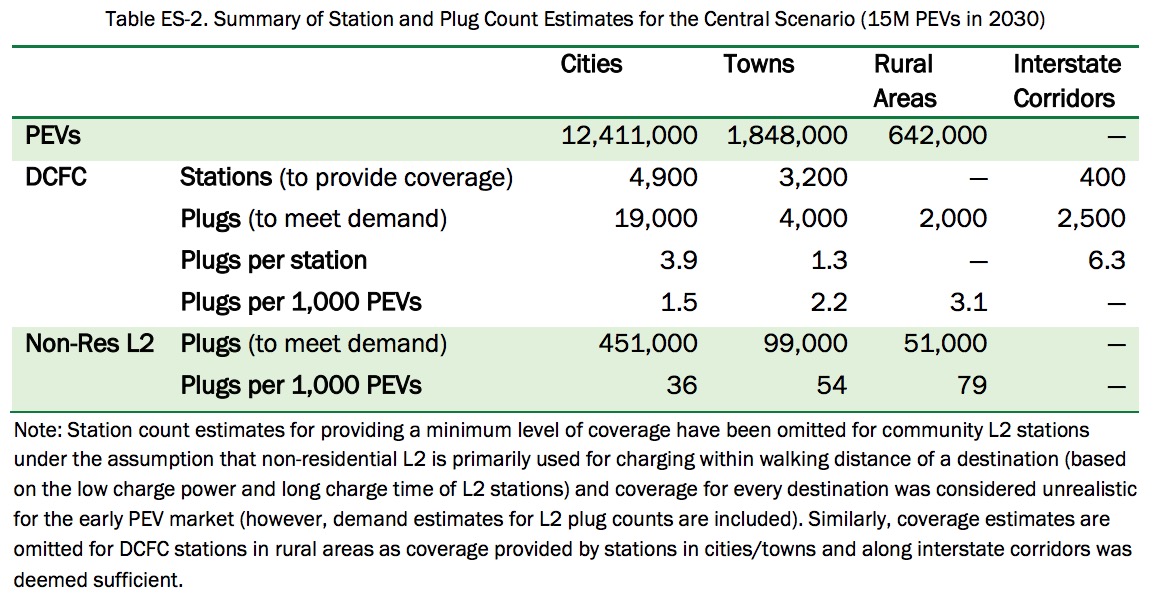
Analysis results for the central scenario are summarized in Table ES-2. Results are reported as numbers of direct current fast charging (DCFC) stations required to provide an acceptable level of coverage and the number of plugs required to satisfy PEV charging demand. Figure ES-2 and Figure ES-4 highlight the sensitivities of these values to the many variables explored in the analysis.
Non-Residential Charging for Communities
The analysis first estimates the minimum DCFC coverage requirements for dispelling range anxiety concerns by providing a safety net of DCFC stations in cities and towns for emergency situations (such as failing to overnight charge at home). To ensure that BEV drivers in cities are never more than 3 miles from a DCFC station, approximately 4,900 DCFC stations are required across the United States. Providing the same level of coverage for towns would require approximately an additional 3,200 DCFC stations.
The analysis also estimates non-residential charging stations (work and public) required to satisfy intracommunity charging demands. Figure ES-2 shows the sensitivity of total national plug requirements to several input variables. In the central scenario, a total of approximately 600,000 non-residential Level 2 (L2) plugs and 25,000 DCFC plugs are necessary to satisfy consumer charging demand (assuming 15 million PEVs are on the road in 2030).
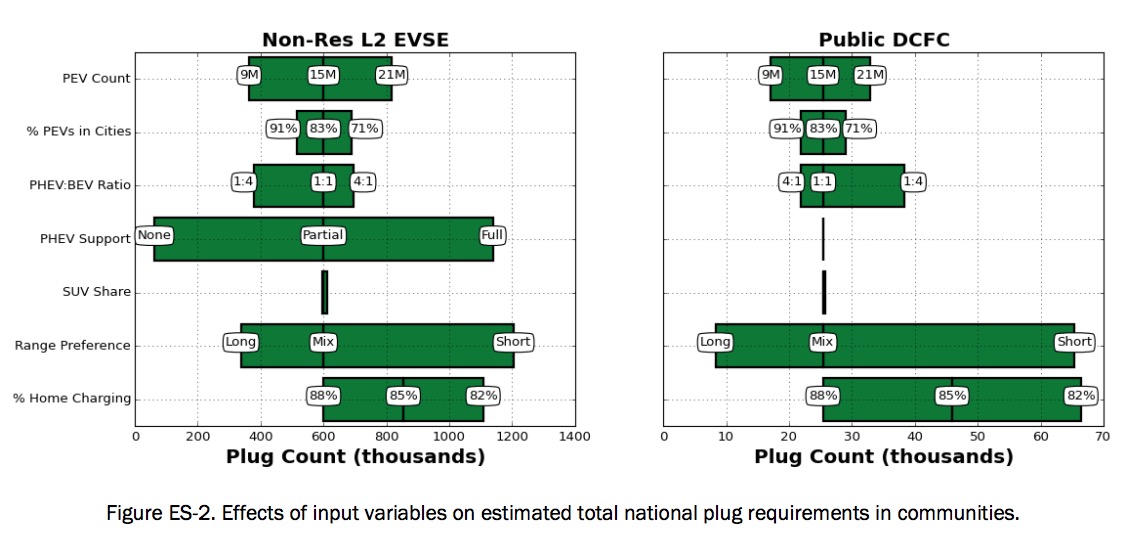
Perhaps surprisingly, the national PEV total is not the most sensitive input parameter in this analysis; PEV electric range, commitment to maximizing PHEV eVMT, and percent of charging taking place at home have the largest effects. For instance, assuming a PEV market composed entirely of PHEV50s (PHEVs with a range of 50 miles) and BEV250s (BEVs with a range of 250 miles) (the long range preference scenario) drops nonresidential L2 requirements to approximately 338,000 plugs and public DCFC to 8,400 plugs. The sensitivity on PHEV support reveals that non-residential L2 charging is modeled almost exclusively as supporting PHEVs, where providing full support (maximizing eVMT for all PHEV owners) results in over 1,100,000 plugs, and providing no PHEV support drops the non-residential L2 plug requirement to under 63,000. Finally, the sensitivity analysis on home charging demonstrates a strong relationship between home charging utilization and non-residential infrastructure requirements. Specifically, a decrease in the amount of charging happening at residential locations from 88% in the central scenario to 82% results in charging requirements increasing to 1,100,000 non-residential L2 EVSE plugs and over 65,000 public DCFC plugs.
Fast Charging Electric Vehicle Infrastructure for Long-Distance Travel Corridors
Long-distance travel has been a barrier to BEV adoption due to real vehicle range limitations, which can be exacerbated by even more restrictive perceived range anxiety. Long-range BEVs have the potential to address this issue if coupled with an extensive and convenient network of DCFC stations that enable reliable intercity travel. The analysis finds that approximately 400 corridor DCFC stations (spaced 70 miles apart on average) are required to provide convenient access to BEV drivers across the U.S. Interstate System. Approximate coverage enabled by DCFC stations in this scenario is visualized in Figure ES-3 with red buffers placed around the Interstate network, each with a radius of 70 miles.
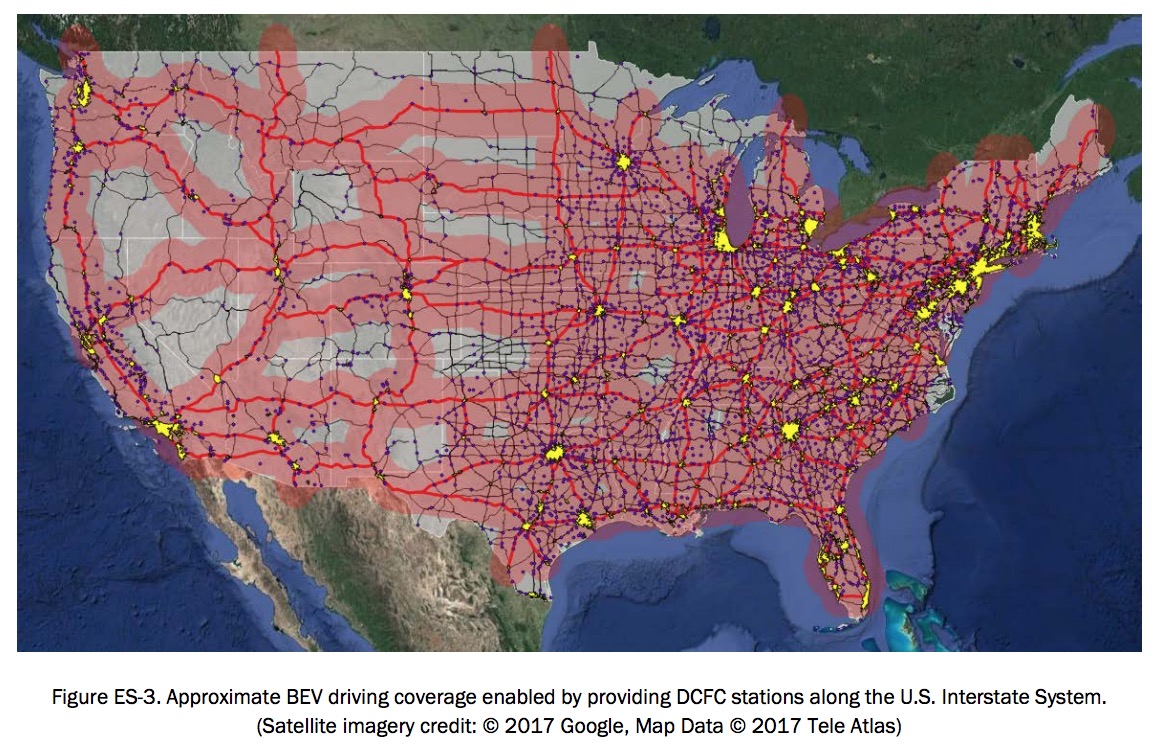
Figure ES-4 shows estimated station and plug counts for corridor fast charging supporting BEV travel along the U.S. Interstate network. Results are presented using parametric sensitivity analysis highlighting the influence of four input variables: 1) network coverage, 2) average station spacing, 3) national BEV count, and 4) average DCFC charge time. For example, 408 corridor DCFC stations are necessary in the central scenario, which assumes full Interstate coverage and 70-mile average station spacing. However, corridor DCFC station counts range from 137 to 713 depending on network and station spacing. Similarly, corridor DCFC plug counts are estimated at 2,472 in the central scenario but vary from 824 to 3,709 in the parametric sensitivity analysis depending on network coverage, size of the BEV fleet, and DCFC charge times.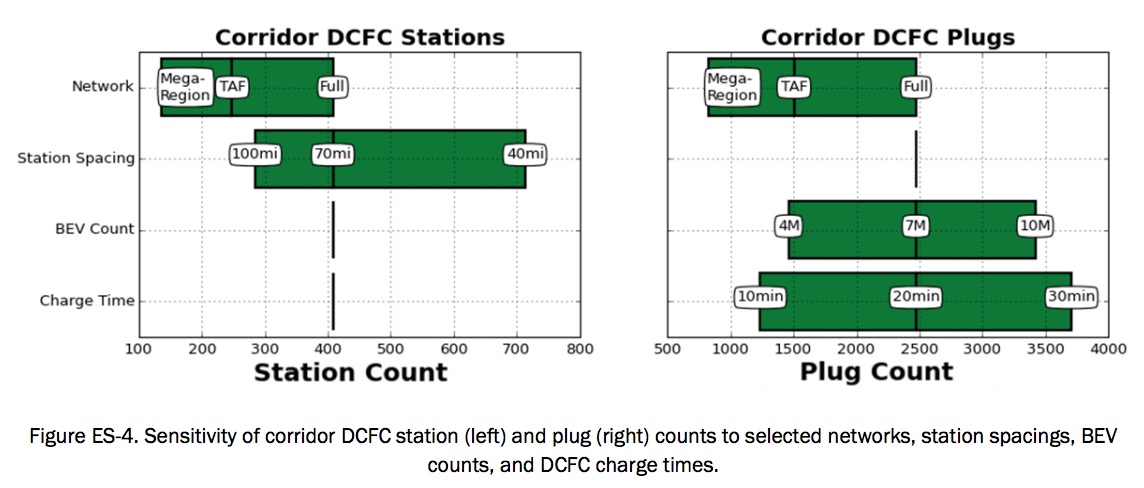
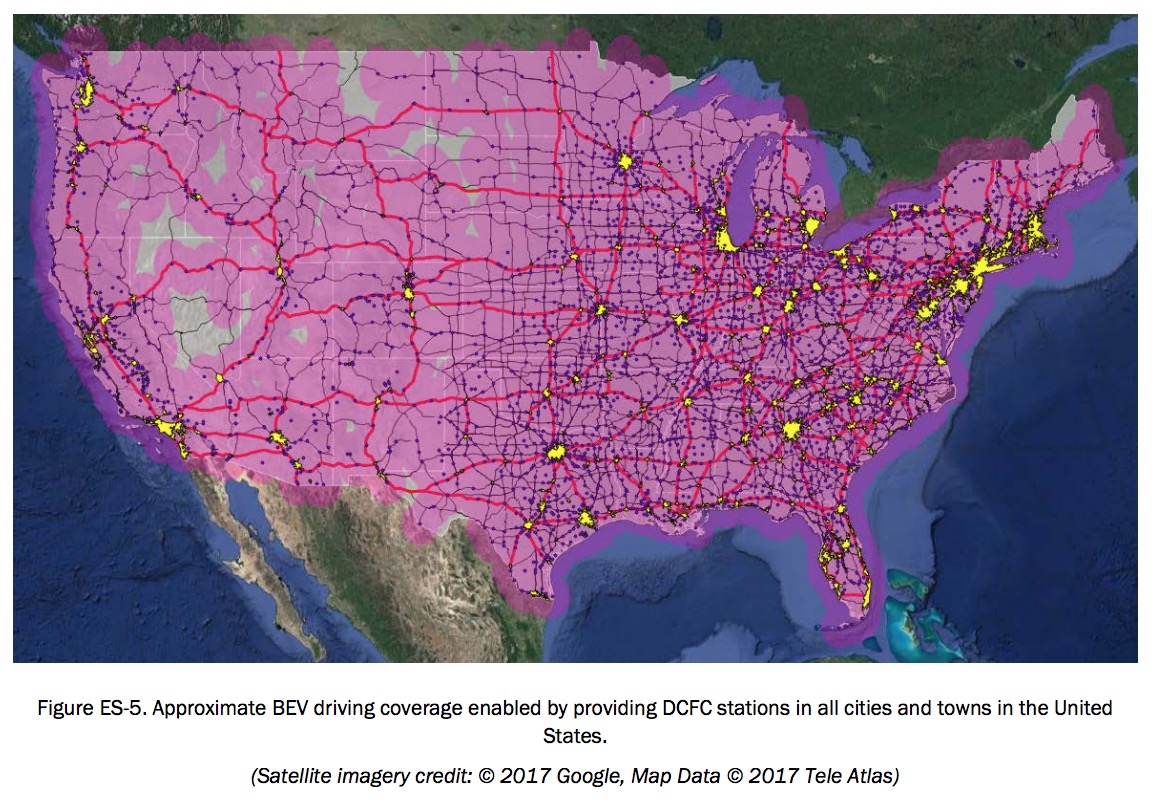
As described above, the U.S. Interstate System provides a basis for electric vehicle infrastructure that can efficiently satisfy long-distance driving demands in the near term. The Interstate System is not, however, entirely isolated from community-based DCFC infrastructure. Although full community-based infrastructure may take longer to establish, it could provide travel corridors with charging backup options, route flexibility, and additional coverage along U.S. highways and state routes. Figure ES-5 shows the national DCFC station coverage enabled by providing the community-based charging station coverage previously discussed. Each covered city and town has a 70-mile radius buffer around it, approximating station coverage.
Major Conclusions
This report categorizes electric vehicle infrastructure requirements by area served (cities, towns, rural areas, and Interstate corridors) and role during early PEV market growth (providing coverage to early PEVs and satisfying demand due to increased PEV adoption). The analysis makes no assumptions about the likelihood of particular PEV market or technology scenarios. Rather, a range of plausible scenarios explores the relationship between the evolution of the PEV fleet and charging infrastructure.
Communities are expected to have significantly larger charging infrastructure requirements than Interstate corridors under both the coverage and demand assessments. About 4,900 DCFC stations are required across cities with an additional 3,200 DCFC stations required in towns to provide a minimum level of nationwide coverage in the communities where 81% of people live. Such a network would dampen range anxiety concerns by providing drivers with a safety net for emergency charging situations.
Intracommunity charging demand analysis demonstrates how utilization of the DCFC coverage network would be expected to grow in increased PEV adoption scenarios based on a home-dominant charging assumption. Results for a 15-million PEV market estimate a DCFC plug requirement of 25,000 in communities (approximately 3.1 plugs per average DCFC station and 3.4 plugs required to support 1,000 BEVs). Demand for non-residential L2 EVSE (including work and public charging) is estimated as 600,000 plugs necessary to support 15 million PEVs (approximately 40 plugs per 1,000 PEVs).
Sensitivity analysis of the community results for consumer charging demand indicates a strong relationship between the evolution of the PEV and EVSE markets. As this analysis attempts to arrive at charging infrastructure solutions that fill the eVMT gaps between consumer travel patterns and PEV electric ranges, electric vehicle infrastructure requirements are not only proportional to the total number of PEVs in the system, but also inversely proportional to PEV electric range. Manufacturer and consumer preferences with respect to electric range, charging power, and utilization of residential EVSE have direct and dramatic consequences on the level of charging demand calculated in this analysis.
Results suggest that approximately 400 corridor DCFC stations are needed to enable long-distance BEV travel along Interstate highways between cities (where the majority of BEVs are likely to be concentrated). Understanding driving patterns, vehicle characteristics, and charging behavior and then prioritizing corridors and setting station spacing accordingly—as illustrated in the network scenarios—could help optimize the utility and economics of early-market corridor charging stations.
Regardless of geographic scope, the analysis suggests that organizations planning for electric vehicle infrastructure to support consumer adoption of PEVs need to be aware of the importance of consumer preferences with respect to electric range and charging behavior. Furthermore, planners should focus on providing consumers with adequate charging coverage (particularly DCFC supporting adoption of BEVs) while monitoring station utilization over time and increasing charging capacity (both in terms of rated power and number of plugs) as the PEV market continues to grow.
Download full version (PDF): National Plug-In Electric Vehicle Infrastructure Analysis
About the US DOE Office of Energy Efficiency and Renewable Energy
energy.gov/eere/office-energy-efficiency-renewable-energy
The mission of EERE is to create and sustain American leadership in the transition to a global clean energy economy. Its vision is a strong and prosperous America powered by clean, affordable, and secure energy.
Tags: DOE, Electric Vehicle Infrastructure, Electric Vehicles, EVs, Office of Energy Efficiency and Renewable Energy, U.S. DOE, United States Department of Energy
 RSS Feed