


BELLWETHER EDUCATION PARTNERS
Introduction
 Nearly 500,000 school buses transport more than 25 million students, over half of the U.S. K–12 population, to and from school each day. In fact, America’s fleet of school buses is more than twice the size of all other forms of mass transit combined, including bus, rail, and airline transportation. There is no doubt that school buses are an iconic part of America’s schools. “National School Bus Glossy Yellow,” the official color of yellow buses, is even part of the National Highway Traffic Safety Administration’s guidelines for school transportation operations.
The traditional yellow school bus was a prominent symbol of American education through the 20th century, but should it remain so in the 21st? After all, the larger transportation sector has seen significant changes in recent history. Over 4 million hybrid cars drive American roads—a remarkable trajectory since their introduction to the U.S. automobile market in the late 1990s. Self-parking and automatic braking technology is common on personal luxury vehicles, and mass-market self-driving cars could be around the corner. Services like Uber and Lyft have revolutionized on-demand personal transportation, creating significant competition for decades-old traditional taxi services. But school transportation still looks much like it has for the past 50 or more years.
Despite its symbolic value, the yellow school bus creates significant operational and environmental inefficiencies in many districts—inefficiencies that increasingly drain district budgets, hamper families’ access to high-quality schools outside their neighborhoods, and damage the environment.
While the traditional, district-operated school transportation model accounts for nearly two-thirds of all school buses on the road today, many districts have turned to contracting with private providers or relying on public transit to meet some or all of their school transportation needs. Movement to different service models is attributable in part to the changing nature of school districts, particularly in urban areas. The dominant yellow bus transportation system is designed to serve a “traditional district,” where students attend centrally located neighborhood schools. But more and more districts are offering families the option to choose from among public schools regardless of their geographic proximity to home. For example, there are now over 6,000 charter schools enrolling nearly 3 million students nationwide. The transportation needs of students who are now crossing town versus crossing the street to attend school are changing the way these districts must think about and deliver school transportation.
The cost of providing school transportation is also increasing. Since 1980, the average cost per student transported has increased by over 75 percent, attributable in part to a steady decline in ridership. The growing cost of providing bus service challenges schools’ ability to invest in updating and upgrading bus fleets and other system infrastructure. As a result, an estimated 250,000 school buses manufactured before 2007, when more stringent emissions regulations took effect, remain in operation. As costs have increased, so too has the impact that school buses have on the environment.
This report examines the structure of school transportation systems, the surrounding regulatory landscape, school transportation funding mechanisms, student safety, the impact of school choice, the growing need for school transportation data, and school transportation’s effect on the environment. Drawing from these various perspectives, it asks whether the traditional system of district-provided school transportation is the best way to get kids to school in different district contexts, explores potential alternatives, and analyzes the practical and policy barriers and incentives around student transportation.
The conclusion is that it’s complicated. School buses unequivocally provide the safest option for transporting students to and from school. And schools have an interest in ensuring reliable transportation service to facilitate student attendance. But this service comes at great cost to districts, and where service quality is poor, ridership may be low. If students aren’t taking the bus, then safety and efficiency benefits of transporting students by bus aren’t realized. And when service is unreliable, then kids are late to school. However, most states restrict the degree to which districts can explore alternative operational models while at the same time failing to fully fund the cost of local school transportation services.
To address these issues within the district-provided transportation model, we recommend:
- investments in basic data collection and technology to drive improved efficiency,
- changes to state funding structures to incentivize efficiency and smart management of capital assets, and
- increased policy flexibility at both the federal and state levels so districts can make decisions that are responsive to the needs of students and families and the local school system context.
But we also recommend that policymakers and the education sector take a hard look at whether it makes sense for school districts to continue as the central administrators of school transportation services, particularly in larger metropolitan areas. At a minimum, districts in metropolitan areas should coordinate with the broader transportation sector to share expertise and consider school transportation decisions in the broader context of community transportation systems. Beyond that, given how much has changed in school systems even in the last 30 years with the growth of choice options, it may be time to consider shifting the administration of school transportation away from schools themselves to a regional entity that may be better equipped to design transportation for a system of schools less beholden to neighborhood or even district boundaries.
The Structure of Student Transportation Systems
Little has changed in student transportation since school buses came on the scene in 1939, when representatives from 48 states developed the first set of school bus standards. Nearly 80 years later, the iconic yellow school bus continues to dominate public school transportation. Currently schools operate about 480,000 school buses, transporting more than 25 million students15 or about 55 percent of the nation’s K–12 population.
The Three Primary Service Models
Three primary service models define the ways districts transport students to and from school: district-provided yellow bus service, contracted yellow bus service through private providers, or reliance on public transit.
District-provided transportation service is by far the most common operational model, and districts own about two-thirds of all yellow school buses. In a district-run system, districts control all elements of school transportation. They purchase buses, plan bus routes, manage vehicle maintenance, and hire, train, and manage bus drivers and other transportation personnel. Under most district-run models, students who live beyond a certain minimum distance from their schools are eligible for bus service. The specific eligibility requirements, such as the distance threshold and exceptions to general eligibility, vary based on districts’ makeup and state requirements for providing bus service. For instance, to protect student safety, a district with hazardous pedestrian conditions near schools—such as railroad crossings, busy highways, or a lack of adequate sidewalks—may opt to transport students living within a smaller radius of the school than a state eligibility policy dictates.
Contracting with a private transportation provider for yellow bus service follows behind direct district-provided service as the second most common model for structuring transportation services. Private contractors own roughly one-third of all yellow buses. Contracted bus service operates in largely the same way as district-provided service. However, like other privatized services, the responsibility for managing the system is no longer borne by the district. Instead, the contractor controls school bus purchases, fleet maintenance, and human capital management. Districts dictate which services contractors provide through the contracting process, which can stipulate operational details as well as technological requirements such as using alternatively fueled buses.
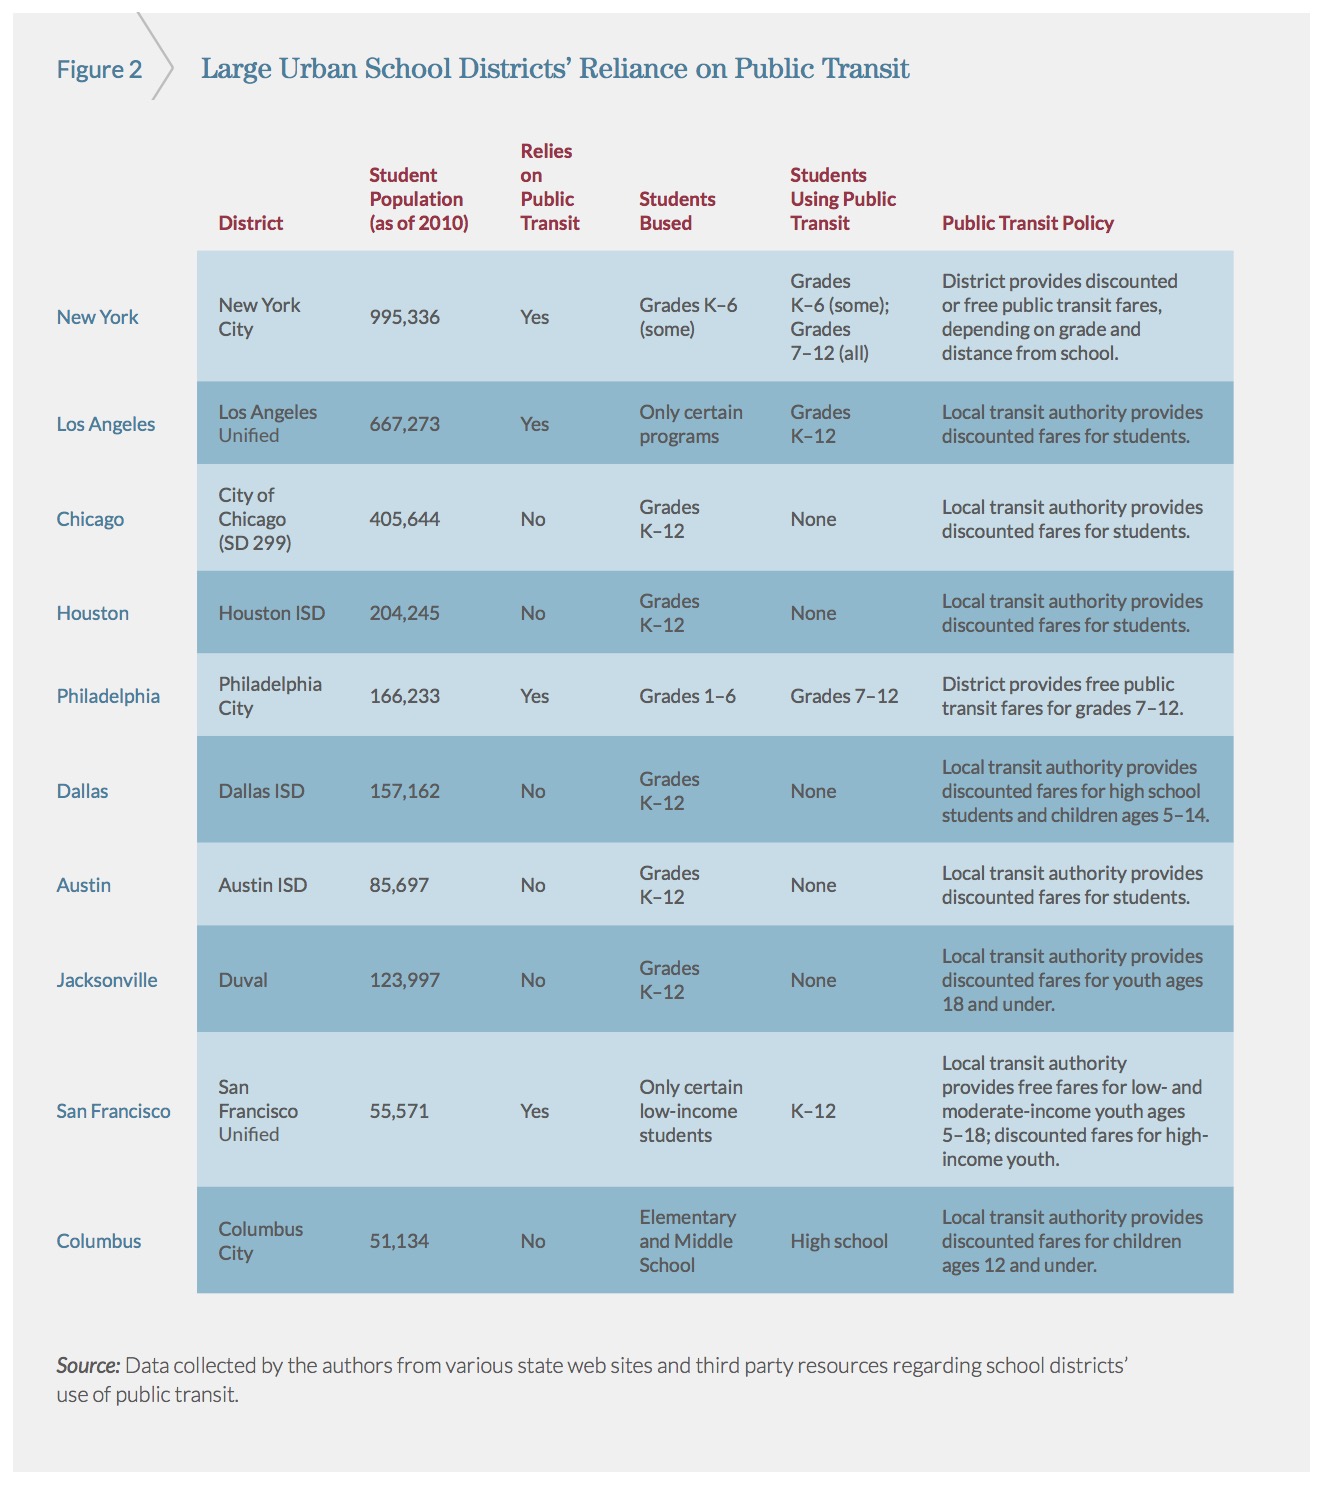
The third method, reliance on public transit, is much less common and generally only used in large urban districts with robust public transit systems. Under this method, students commute to school using the city’s existing public transit infrastructure. Often, the district, city, or county partially or fully subsidizes students’ fares. However, relying on public transit provides districts with little to no control over operations. Federal regulations prevent public transit providers from providing student-only buses and routes apart from the general public (see “The Intersection of Federal Transportation and School Transportation Regulation,” page 14). Thus, students ride public transit with the general public and are not transported directly to their school, unless a particular school’s location is also a regularly scheduled public transit destination.
While these models can exist independently, they are often combined. For example, Cincinnati Public Schools provides school bus transportation for students in grades K–6, while students in grades 7–12 are responsible for traveling to school using public transit. Additionally, the district contracts with private providers on an ad hoc basis when it needs additional bus capacity beyond its own fleet’s capabilities.
Human Capital
According to the Bureau of Labor Statistics’ most recent employment data, U.S. schools employ over 500,000 school bus drivers. Federal regulations require all school bus drivers to obtain a commercial driver’s license (CDL), undergo drug and alcohol testing, and receive additional training before transporting children. While the exact requirements of training vary by state, it ranges from about 10 to 40 hours and includes topics such as behavior management, emergency procedures, and first aid.
On average, school bus drivers earn about $14.70 per hour, significantly less than other occupations that require a CDL. For example, transit and intercity bus drivers earn an average of $19.31 per hour, while heavy and tractor-trailer truck drivers make over $20 per hour.
Due to the higher average pay that drivers can find in other industries requiring similar qualifications, both districts and contractors struggle to hire an adequate number of school bus drivers, and this shortage is felt fairly consistently across the country. According to a survey of school bus contractors by School Bus Fleet, an industry organization, 28 percent of respondents indicated a severe or desperate shortage. Only 6 percent of respondents reported having no shortage of drivers. That was down from 2014 and 2013, when 15 percent and 27 percent, respectively, reported having no driver shortage. This recent uptick in driver need is also linked to the ongoing economic recovery—as unemployment decreases, the severity of bus driver shortages tends to increase.
Download full version (PDF): Bringing School Transportation into the 21st Century
About Bellwether Education Partners
bellwethereducation.org
Bellwether Education Partners is a national, nonpartisan nonprofit of more than 50 professionals dedicated to helping education organizations become more effective in their work and achieve dramatic results, especially for the most underserved students. To do so, we work in the public, private, and nonprofit sectors and provide a unique combination of exceptional thinking, talent, and hands-on strategic support.
Tags: Bellwether Education Partners, National Highway Traffic Safety Administration, School Buses
 RSS Feed