


BLACK & VEATCH
Introduction
On August 3, 2015, President Obama announced the Environmental Protection Agency’s (EPA) final Clean Power Plan (CPP) rule for reducing carbon dioxide (CO2) emissions from existing fossil fuel electric generating units (EGUs).
The final rule establishes CO2 emission performance rates based upon the EPA’s determination of the best system of emission reduction. It applies to two subcategories of existing EGUs – including electric utility steam generating units and stationary combustion turbines.
The CPP rule also sets forth state‐specific CO2 goals reflecting the emission performance rates, as well as guidelines for the development, submittal and implementation of state plans that will ultimately establish emission standards or other measures to achieve the state CO2 reduction goals.
Basis for Regulatory Action
Clean Air Act section 111(d) provides for performance standards for existing sources that reflect the extent to which emissions can be limited through the application of the “best system of emission reduction” (BSER) that the EPA determines has been “adequately demonstrated.”
This is a somewhat unique provision of the Clean Air Act in which the EPA essentially sets forth guidelines for states to use in establishing final standards within formal plans for implementing the BSER. The process essentially leaves it up to each state to determine the structure and requirements of the regulatory program in a state implementation plan (SIP) to be approved by the EPA.
The CPP is the agency’s guidance rulemaking that proposes state‐specific goals reflecting the EPA’s calculation of the BSER. The EPA has determined that the best system of reducing CO2 emissions comprises three “building blocks” that the states can use to achieve CO2 emissions reductions from existing EGUs:
- Improving heat rate at affected coal‐fired steam EGUs.
- Substituting increased generation from lower‐emitting existing natural gas combined‐cycle units for reduced output from higher‐emitting affected steam generating units.
- Substituting increased power production from new zero‐emitting renewable energy generating capacity for reduced generation from affected fossil fuel‐ fired generating units.
It is important to note that the EPA completely removed nuclear generation and demand‐ side energy efficiency from what was originally proposed as BSER in its June 2014 draft rule, and made some refinements to the remaining building block measures. The implications for nuclear including existing plants, updates and new construction will be addressed later in this paper.
To aid in compliance with the CPP, states also have a variation on the earlier proposed ‘portfolio’ approach to compliance. Under the CPP, states may now implement policy measures and other mechanisms to meet their stated goal, including smart grid, demand response, and other advanced energy technologies or programs, to the extent that they help reduce emissions.
The Rule recognizes demand response, for instance, as a compliance measure when it reduces megawatt‐hours of generation. Transmission and distribution‐level efficiencies made possible by smart grid, such as Volt‐VAR optimization and Conservation Voltage Regulation, are also recognized for their ability to reduce end‐use consumption. As these technologies also serve to make the grid more reliable, they could be attractive to state policymakers responding to the CPP. The CPP also acknowledges that demand response (or demand‐side management as the plan refers to it), produces savings and is not simply a shifting of energy production and consumption.
Performance Goals
The EPA is setting uniform emission performance rates, phased in from 2022 through 2030, for two subcategories of EGUs. Specifically, for existing fossil fuel‐fired electric utility steam generating units, the EPA established a uniform interim CO2 emission performance rate of 1,534 pounds (lbs.) CO2 / megawatt‐hour (MWh) and a final rate of 1,305 lbs. CO2/MWh. This compares with a nominal average CO2 emission rate of about 2,000 lbs. CO2/MWh for the existing coal fleet. The interim rate established for stationary combustion turbines is 832 lbs. CO2/MWh, with a final rate of 771 lbs. CO2/MWh. These emission performance rates were derived from 2012 emission and generation data for the affected existing EGUs, and reductions that the EPA believes can be achieved through application of the three building block best system of emission reduction (BSER) measures.
It appears that the inclusion of the emission performance rates may have been designed by the EPA to protect the Rule from litigation, given comments that moving away from such standards would be a departure in how the EPA has regulated power plant emissions under other features of Clean Air Act, including the application of new source performance standards.
The EPA applied these performance rates to each state’s particular mix of fossil fuel‐fired EGUs to generate the state’s carbon intensity goal for 2030 (and interim rates for the period 2022‐2029). The individual statewide goals are rate‐based CO2 goals (expressed in lbs. CO2/MWh) that represent the weighted aggregate of these emission performance rates for each state’s EGUs, as well as alternative equivalent mass‐based goals (expressed in tons of CO2). Each state must now decide whether to apply these performance rates to each affected EGU, or to take an alternative approach and meet either an equivalent statewide rate‐based goal or statewide mass‐based goal.
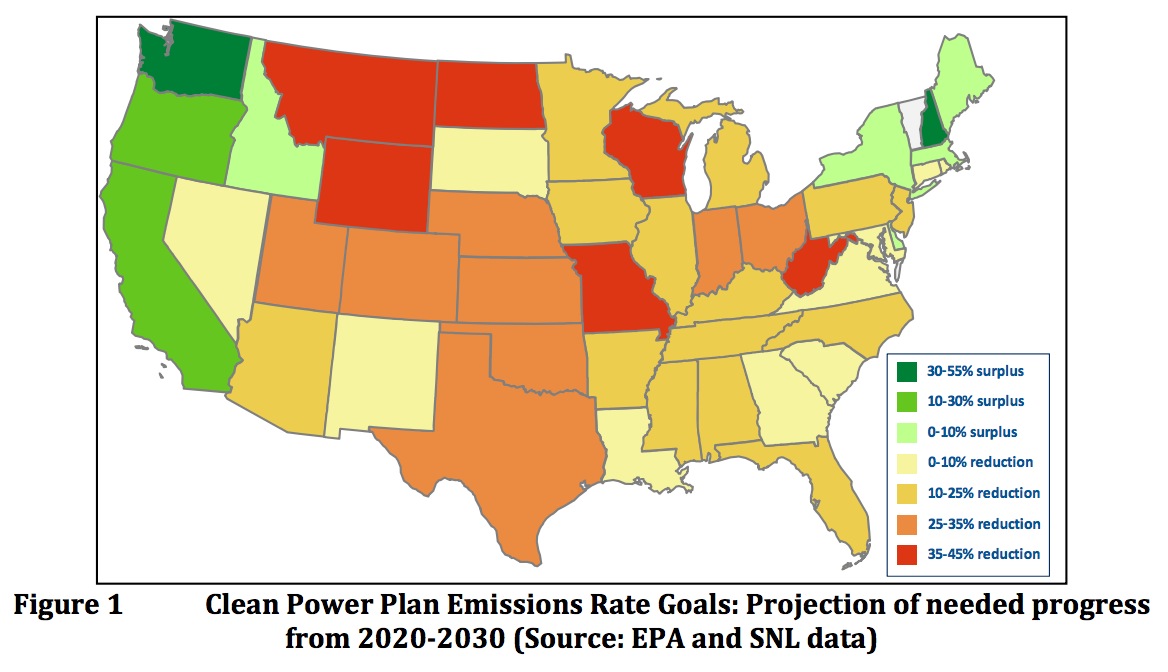
Based on the current expectations of generation capacity changes and regional plans to reduce emissions, some states are well positioned to meet CPP’s 2030 emissions rate goals. As shown in Figure 1 below, states along the West Coast and in the Northeast are expected to have state CO2 emission rates below what is prescribed in the final CPP rule by 2030. States in red, like Missouri, West Virginia, and Wisconsin will need to make sizeable reductions within the state or start developing multi‐state plans with nearby states that may have a surplus.
Reductions to achieve the emission performance rates, or statewide rate‐based and mass‐ based goals, must be made in interim (2022‐2029) and final (2030) compliance periods. The eight‐year interim period from 2022 through 2029 is separated into three steps, 2022‐ 2024, 2025‐2027, and 2028‐2029, each associated with its own interim CO2 emission performance rates or statewide goals.
A state may adopt emission standards for its sources that are identical to the interim emission performance rates or, alternatively, alter the standards to accommodate the timing of expected reductions, as long as the state’s interim goal is met over the eight‐year period.
It is important to note that the Rule does not require that every EGU coal plant needs to hit the 1,305 lbs. CO2/MWh standard, or every combined‐cycle combustion turbine plant has to hit the 771 lbs. CO2/MWh standard. However, under the EGU rate based compliance structure, if a state does not adopt a statewide compliance approach, the state’s EGUs would have to achieve the emission performance rates. In principle, such compliance could be achieved through co‐firing with lower carbon fuels, reducing the capacity factor or otherwise purchasing renewable energy credits or integrating renewables. Should the CPP ultimately be implemented it is anticipated that states will adopt some form of statewide compliance plan. As a result, the emission performance rates for specific EGUs will not be relevant for the most part.
Download full version (PDF): Market Impacts of the Clean Power Plan
About Black & Veatch
www.bv.com
Black & Veatch is an employee-owned, global leader in building critical human infrastructure in Energy, Water, Telecommunications and Government Services. Since 1915, we have helped our clients improve the lives of people in over 100 countries through consulting, engineering, construction, operations and program management.
Tags: Black & Veatch, Black & Veatch Insights Group, Clean Power Plan, CPP, Emissions, Environmental Protection Agency, EPA, GHG
 RSS Feed