


INRIX RESEARCH
Executive Summary
 The INRIX 2017 Traffic Scorecard is the largest and most detailed study of congestion to date. It includes data on 1,360 cities in 38 countries covering more than 100,000 square miles (250,000 square kilometers) of road and focuses on congestion across all times of the day and week. It confirms, as previous INRIX Traffic Scorecards have found, that congestion is a significant and growing burden on our cities. It is clear that congestion is a global phenomenon, and impacts businesses as well as commuters, small cities as well as large ones and developing as well as developed economies.
Population and economic growth alongside continued urbanization are the root causes of congestion. By 2050 there will be 9.7 billion people in the world, 70 percent of whom will live in cities.1 Over the same period, the global economy is expected to triple in size leading to more than a doubling in road and rail travel and more than a three-fold increase in the amount of road and rail freight.2 In our estimation, the share of private cars will continue to increase strongly in developing regions and fall only slightly in developed economies. As a result, vehicle-miles traveled (VMT), i.e. the amount people drive, will likely grow at a slower pace than years prior in developed countries, while per-capita VMT may stagnate or slightly fall. Freight VMT will also continue to rise as urban populations grow along with demand for goods and services.
The challenges faced by households, private companies, transportation officials and all levels of government cannot be understated. Left unchecked, congestion will continue to rise. Good data is the first step in tackling this problem. For most cities, applying Big Data to create intelligent transportation systems will be key to solving urban mobility problems, as adding transportation capacity becomes more expensive and budgets remain constrained. INRIX data and analytics on traffic, parking and population movement help city planners and engineers make data-based decisions to prioritize spending in order to maximize benefits and reduce costs now and for the future.
For example, in 2017, the Los Angeles Department of Transportation (DOT), City of Calgary, Iowa DOT and Ohio DOT, among others, selected INRIX Roadway Analytics for instant and highly precise road performance analysis. The cloud-based traffic analysis tools help cities, states and countries identify areas that benefit most from road improvements, reduce the cost of operations, and more accurately measure and report the impact of transportation investments.
The key findings of the INRIX 2017 Traffic Scorecard provide a quantifiable benchmark for governments and cities across the world to measure progress in improving urban mobility and track the impact of spending on smart city initiatives. Our City Dashboard is available for free at inrix.com/ scorecard and allows users to dive into a great number of congestion metrics that are too detailed to publish in this report.
1.2 Data and Methods
In 2017, INRIX Traffic Scorecard grows by 33 percent, increasing coverage to 1,360 cities in 38 countries – making it the largest ever study of congestion.
This year’s Traffic Scorecard adopted the same methodology as the 2016 edition, which provides insights into the scale and impact of congestion at different times of the day and therefore on different users. For example, congestion during peak hours primarily affects commuters, while congestion during the day tends to impact businesses more.
We continue to measure the impact of congestion on car commuters, by estimating the total number of hours the average commuter spends in congestion in each city. To provide greater insight into how congestion affects different road users, we estimate the percentage of time that drivers would spend in congestion in each city at different parts of the day and week, and on different parts of the road network. These include peak, midday, evening and weekends, and highways into or out of the city compared to the inner-city road network. A weighted average is calculated based on trip volume at different points in time and location, and the relative size of cities. This urban transportation metric is called the INRIX Congestion Index (ICI) and provides an overall measure of the health of a city’s road network.
Additionally, for three countries (US, UK and Germany) INRIX Research estimated the total economic cost of congestion to both individual drivers and to cities, encompassing the direct (e.g. time and fuel wasted) and indirect (e.g. lost productivity) costs of congestion in 2017.
Full details of the methodology and data sources are provided in the next section.
1.3 Key Findings
The INRIX 2017 Traffic Scorecard analyzes and compares the state of traffic congestion in countries and major urban areas worldwide.
In 2017, the US moved from fourth place to fifth, tied with Russia, in the global rankings with drivers spending 41 peak hours (i.e. commuting) a year in congestion. Thailand tops the list in 2017 with drivers spending an average of 56 hours in peak hour congestion. Other countries in the top five include: Indonesia (51 hours), Colombia (49 hours) and Venezuela (42 hours). The UK comes in 10th (31 hours) and Germany 11th (30 hours).
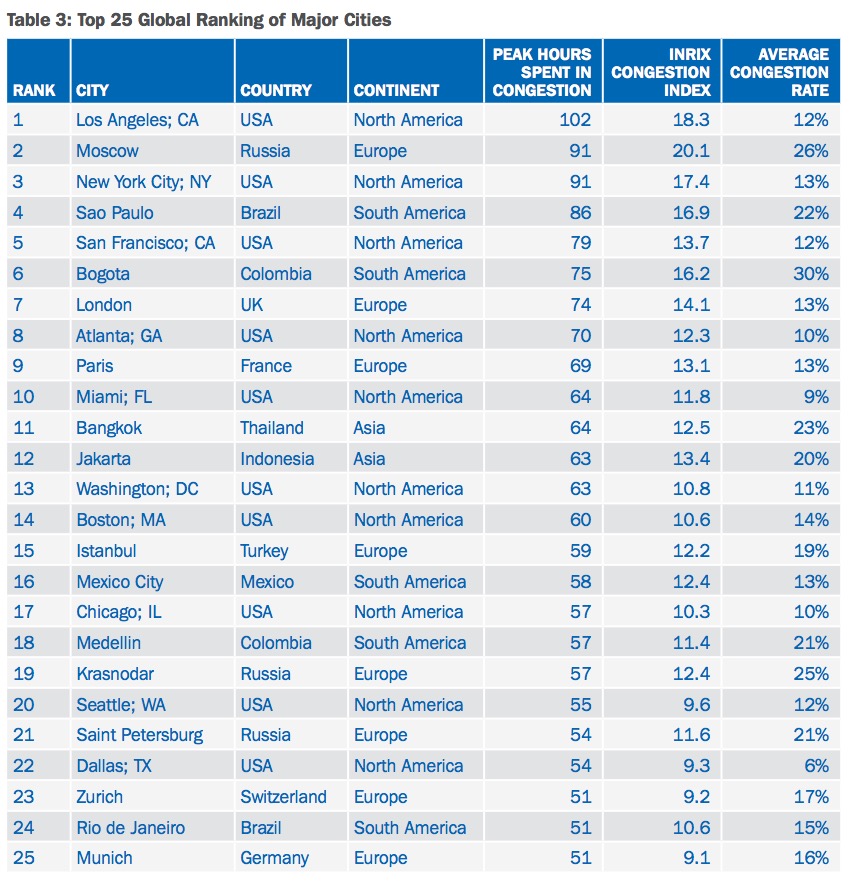
While the US may be fifth overall, American cities dominate the top 10 most congested cities led by Los Angeles (first), New York (third), San Francisco (fifth), Atlanta (eighth) and Miami (10th). Commuters in Los Angeles spent 102 hours last year sitting in traffic jams – more than any other city in the world. In Europe, Moscow tops the major city ranking where drivers spent 91 hours in congestion, unchanged from last year, followed by London (74 hours), Paris (69 hours) and Istanbul (59 hours).
Across the 1,360 cities studied, drivers spent an average of nine percent of their travel time staring at the bumper in front of them as average traffic speed in congestion was just 8.9 mph (14.4 kph), the same speed as 2016. Dublin remains the slowest major city studied at 4.6 mph (7.4 kph) during all congested periods, with peak hour speeds at 3.7 mph (6 kph). Out of the cities studied, Oaxaca, Mexico was the slowest city with average congested speeds of 3.6mph (5.9 kph).
2.1 INRIX Real-Time Traffic Data
INRIX operates the most robust driver network in the world that includes 300 million connected cars and devices, covering more than 5 million miles (8 million kilometers) of roads, ramps and interchanges in more than 40 countries. Our breakthrough technologies enable us to intelligently gather and analyze complex data streams containing nearly 2 billion data points per day to create automotive-grade traffic services.
INRIX combines anonymous, real-time GPS probe data with traditional real-time traffic flow information and hundreds of market-specific criteria that affect traffic – such as construction and road closures, real-time incidents, sporting and entertainment events, weather forecasts and school schedules – to provide the most accurate picture of current traffic flows. The latest INRIX XD Traffic technology provides real traffic information at highly granular 100 meter increments, compared to the 1- to 3-mile road segments typically employed.
This real-time traffic data is at the heart of the INRIX 2017 Traffic Scorecard.
2.2 Innovative Congestion Metrics
A key component of INRIX Real-Time Traffic Data is the proprietary INRIX Vehicle Tracking Algorithm, which classifies each second of a single vehicle trip as congested or free flow. Congestion is defined as a speed below 65 percent of the free-flow speed, which is not an arbitrary or unachievable overnight speed, but the typical uncongested speed on that road segment.
The result of this innovation is a measure of congestion that reflects the real-world experience and expectations of drivers. The total drive time can be separated into congested or free flow, and the ratio of these is the congestion rate, or the percentage of driving time that is spent in congestion.
Congestion varies at different times of the day and on different parts of the road network. Traffic congestion is directly related to the supply of road space and the demand for road space. A narrow road, deep in a city center at rush hour, will be heavily congested in comparison to a wide highway in the late evening. It also affects different groups of people. Peak hours of congestion primarily affects car commuters while daytime congestion largely affects businesses.
To balance various aspects of travel to and within an urban area, congestion rates are calculated for seven main periods and travel patterns in an urban area:
- Peak periods on highways in and out of the city
- Peak periods within a city
- Day time travel on highways in and out of a city
- Day time travel within a city
- Late night on highways in and out of a city
- Late night within a city
- Weekend travel on all roads
While the City Dashboard available at inrix.com/scorecard provides each of these variables for every city, for the sake of brevity, this report focuses on three headline metrics derived from these congestion rates:
Average Congestion Rate: The simple (i.e. unweighted) average of the seven congestion rates above, which therefore estimates the percentage of total drive time the average driver spent in congestion averaged across all periods of the day and all sections of the road network. This is a metric for the impact on the typical driver.
INRIX Congestion Index: The seven congestion rates are weighted by relative volumes to provide a more realistic average congestion rate that reflects typical driving patterns, which is then weighted by the Median Travel Time. This, in effect, adjusts the congestion rate by the city’s size and associated average journey times. This is the metric for transportation officials.
Peak Hours Spent in Congestion: Applying the average peak period congestion rate to travel times allows a derivation of daily time spent in peak period congestion. Assuming 240 working days a year, the average number of hours spent in congestion during peak hours is estimated for every city. This a metric for the impact on the typical car commuter.
Two further methodological innovations were made in the INRIX 2016 Traffic Scorecard, which we continued to use in 2017. First, relating to the definition of a city (or urban area) and second to the definition of peak hours.
Previous INRIX Traffic Scorecards have relied upon Census Bureau or Eurostat Larger Urban Area statistical definitions of metropolitan areas as the geographic definition of ‘city’ or ‘urban area’ in the analysis. While those boundaries continue to serve a vital role, a quantitative definition of an urban area provides a better fit for transportation movement and analytics. The INRIX 2016 Traffic Scorecard rectified this problem and allowed global comparison between urban areas by clustering dense roadways to form an urban boundary. These urban boundaries allow a fresh and comparable analysis across official city, country and continent boundaries.
Peak hours have historically been defined as 6-9 am and 4-7 pm in previous INRIX Traffic Scorecards. From the INRIX 2016 Traffic Scorecard, peak hours are locally defined based upon the actual driving habits in each city. Given the global scale of the INRIX Traffic Scorecard, this is very important as there are stark cultural differences in commuting patterns and business hours.
Download full version (registration required): INRIX Global Traffic Scorecard
About INRIX Research
inrix.com/research
Launched in 2016, INRIX Research uses INRIX proprietary big data and expertise to make the movement of people and goods more efficient, safer and convenient.
Tags: Global Traffic Scorecard, INRIX, INRIX Research, Traffic, Traffic Study
 RSS Feed