


UCLA INSTITUTE OF TRANSPORTATION STUDIES
SOUTHERN CALIFORNIA ASSOCIATION OF GOVERNMENTS (SCAG)
Executive Summary
In the last ten years transit use in Southern California has fallen significantly. This report investigates that falling transit use. We define Southern California as the six counties that participate in the Southern California Association of Governments (SCAG) – Los Angeles, Orange, Riverside, San Bernardino, Ventura and Imperial. We examine patterns of transit service and patronage over time and across the region, and consider an array of explanations for falling transit use: declining transit service levels, eroding transit service quality, rising fares, falling fuel prices, the growth of Lyft and Uber, the migration of frequent transit users to outlying neighborhoods with less transit service, and rising vehicle ownership. While all of these factors probably play some role, we conclude that the most significant factor is increased motor vehicle access, particularly among low-income households that have traditionally supplied the region with its most frequent and reliable transit users.
Transit service and use trends in Southern California
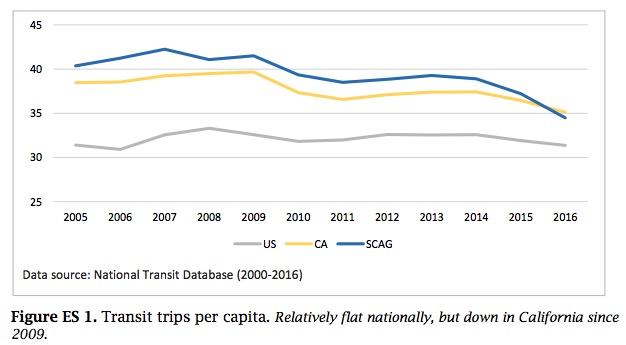
Long associated with the automobile, in the last 25 years Southern California has invested heavily in public transportation. Since 1990, the SCAG region has added over 100 miles of light and heavy rail in Los Angeles County, and over 530 miles of commuter rail region-wide. These investments, however, have not been matched by increases in transit ridership. Transit ridership in the SCAG region reached its postwar peak in 1985. Through the 1990s and 2000s ridership rose and fell modestly, but never again reached its 1985 level. Figure ES-1 shows that per capita trips have been mostly declining in the SCAG region since 2007, and have fallen consistently since 2013.
This decline spans modes; it is not simply a case of bus ridership falling while rail ridership increases. Rail ridership, on net, is also down. Further, these aggregate numbers mask large asymmetries in transit service and use. Transit use in particular is heavily concentrated among a relatively small segment of the population, in a small number of the region’s neighborhoods, and on a small share of the region’s transit systems. As a result of these asymmetries, even small changes in these households, neighborhoods, or transit systems can have an outsized effect on regional transit use.
A few people make most of the trips
The average resident of the SCAG-region made about 35 transit trips in 2016, but the median resident made none. Only a minority of the population rides transit very frequently or even occasionally. About two percent of the population rides transit very frequently (averaging 45 trips/month), another 20 percent of the population rides transit occasionally (averaging 12 trips/month), and more than three-quarters of SCAG-region residents ride transit very little or not at all (averaging less than 1 trip/month). Heavy transit use, moreover, is concentrated among the low-income population, and especially low-income foreign born residents.
A few neighborhoods generate most of the trips
Ten percent of all of the people who commuted to and from work on transit in 2015 lived in 1.4 percent of the region’s census tracts, which covered just 0.2 percent of the region’s land area; the average number of transit commuters in these few tracts was almost 12 times the regional average. Fully 60 percent of the region’s transit commuters lived in 21 percent of the region’s census tracts, which occupied 0.9 percent of the region’s land area. Overall, the most urban and transit-friendly neighborhoods in the SCAG region comprise less than one percent of the region’s land area. These neighborhoods hold about 17 percent the region’s population, but 45 percent of its transit commuters. So while the region’s transit systems are increasingly diverse and far reaching, transit riders remain highly concentrated.
A few operators carry most of the passengers
The SCAG region has over 100 transit operators, but just a few them carry the vast majority of riders. Figure ES-2 shows that nine percent of the region’s operators are responsible for 60 percent of the region’s transit service and carry about 80 percent of all transit riders.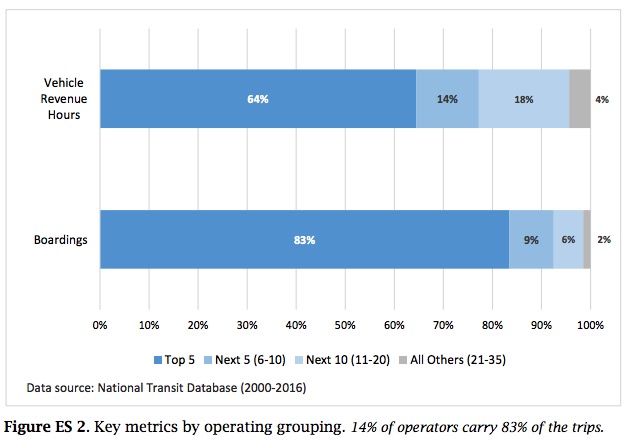
Because service and riders are concentrated on the largest systems, ridership losses are concentrated on these systems as well. Four SCAG-region operators—LA Metro, Orange County Transportation Authority (OCTA), Los Angeles Department of Transportation (LADOT), and the Santa Monica Big Blue Bus— accounted for 88 percent of the state’s ridership losses between 2010 and 2016. LA Metro by itself accounted for a remarkable 72 percent of the state’s losses. Because LA Metro’s losses are themselves highly concentrated, a dozen routes in LA County account for 38 percent of all the lost ridership in California. In fact, half of California’s total lost ridership is accounted for by 17 LA Metro routes (14 bus and 3 rail lines) and one OCTA route.
Possible causes of eroding transit use
Why is transit use falling? We consider a number of potential explanations, and review our findings below.
Changes in transit service and fares have mostly followed and not led falling ridership
Transit use can fall if transit becomes harder to use: if service declines, or fares rise. It does not appear, however, that these factors played a large role in the SCAG region’s falling ridership. While transit fare increases are never popular, they are occasionally necessary to keep pace with rising costs. Figure ES-3 shows the inflation-adjusted trends in average fare paid per mile of transit travel between 2002 and 2016 in the U.S., California, and the SCAG region. Fares in Southern California are lower than those in the rest of the state and the country and have been remarkably flat over time.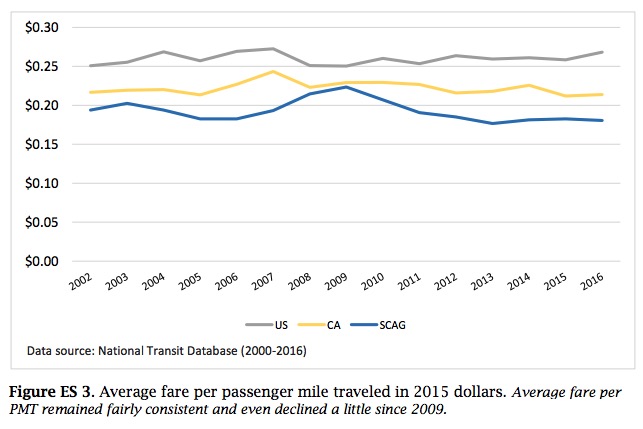
These regional averages can mask significant variation among transit operators. In particular, inflation-adjusted fares per boarding for both OCTA and the Big Blue Bus increased by about 50 percent between 2002 and 2016 — to nearly $1.25 and $0.75 per boarding respectively. So while fares have probably not caused significant ridership declines across the region, they may have played a role at operators like OCTA and Big Blue.
Transit service in the SCAG region, moreover, mostly rose while ridership was falling, and ridership fell even on routes that maintained excellent on-time records. These circumstances suggest that service quantity and reliability were not large factors in falling transit use. There is some evidence, admittedly limited, that riders felt unsafe on transit vehicles in recent years, which may have contributed to the ridership decline.
Fuel prices have likely played a contributing, but not leading role
Fuel prices have been volatile since 1998, but have fallen substantially since peaking in 2012. Figure ES-4 compares trends in fuel prices and transit use in the Los Angeles metropolitan area. While there is a generally positive relationship (as fuel prices rise so too does ridership), it is a relatively weak one – fuel prices rise and fall much more dramatically than transit patronage. The timing of transit’s decline, moreover, is not conducive to a fuel price explanation. Per capita transit use in Southern California has been mostly falling since 2007, and it fell between 2009 and 2011 when fuel prices were rising sharply.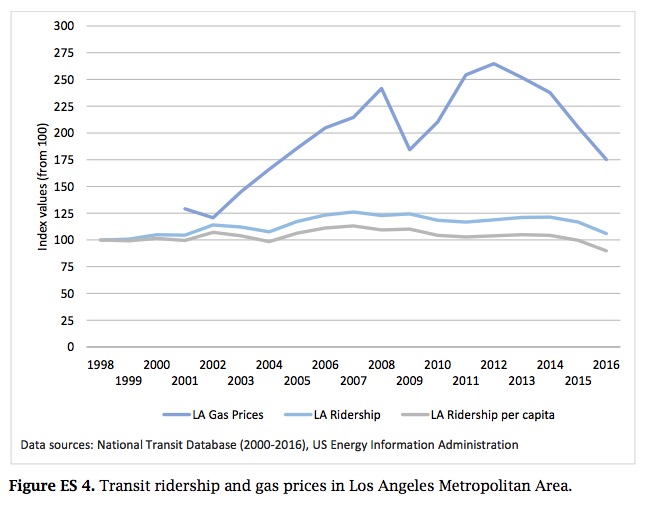
The Transportation Network Companies do not appear to have cannibalized transit
We have very little data that lets us directly measure the effect of transportation network companies (TNCs, like Lyft and Uber) on transit use. What evidence we do have suggests that most TNC trips are probably not replacing large numbers of transit trips. The typical TNC user does not resemble the typical transit rider, the typical TNC trip does not occur when and where most transit trips occur, and most TNC users report no change in their travel by other modes. However, if the pool of TNC users continues to expand, the effect of TNCs on transit use — both positive and negative — may expand as well.
Evidence about neighborhood change and migration of lower-income people is mixed, but suggestive
Transit is heavily-supplied in a small proportion of places, and heavily used by a small proportion of people. If the neighborhoods where transit quality is high change, and become less likely to hold the small group of people who use transit regularly, then transit use could fall. We find some evidence consistent with the idea that neighborhood change has been associated with less transit use. Areas that were heavily populated with transit commuters in the year 2000 became, in the next 15 years, slightly less poor, and significantly less foreign born. Perhaps most important, the share of households without vehicles in these neighborhoods fell notably. All these factors align with a narrative where a transit-using populace is replaced by people who are more likely to drive. We emphasize, however, that this relationship is not one we can measure with precision, and it would be premature to declare neighborhood change a large culprit in falling transit ridership.
Download full version (PDF): Falling Transit Ridership
About the UCLA Institute of Transportation Studies
www.its.ucla.edu
The mission of the UCLA Institute of Transportation Studies, one of the leading transportation policy research centers in the United States, is to support and advance cutting-edge research, the highest-quality education, and meaningful and influential civic engagement on the many pressing transportation issues facing our cities, state, nation, and world today.
About the Southern California Association of Governments
www.scag.ca.gov
SCAG is the nation’s largest metropolitan planning organization, representing six counties, 191 cities and more than 18 million residents. SCAG undertakes a variety of planning and policy initiatives to encourage a more sustainable Southern California now and in the future.
Tags: CA, California, Car ownership, Falling Transit Ridership, Fuel prices, ITS, Los Angeles, SCAG, Southern California Association of Governments, UCLA, UCLA Institute of Transportation Studies
 RSS Feed