


AMERICAN TRANSPORTATION RESEARCH INSTITUTE
Trucks transported nearly 10 billion tons of freight representing over two-thirds (68.8 percent) of total domestic tonnage shipped, and traveled more than 279 billion miles on the nation’s roadway network in 2014. Due to the critical role of safe and reliable truck movements in sustainable economic growth, it is essential to continually monitor and evaluate the efficiency of the national roadway system. A key impediment to nimble supply chains is the level of traffic congestion experienced on U.S. roadways, and the subsequent costs that are incurred due to this congestion.
In 2014 the American Transportation Research Institute (ATRI) conducted research quantifying the amount of delay experienced by the trucking industry on the U.S. Interstate Highway System (IHS) in 2012 and 2013. In an effort to continually monitor and quantify congestion, ATRI has now implemented a number of standardization procedures to enable the comparison of these figures on a year-over-year basis including:
- Utilizing publicly available highway usage figures for the year studied;
- Utilizing the national trucking industry cost of operation figure specific to the year studied;
- Establishing a standardized methodology for quantifying the amount of delay; and
- Establishing a standardized methodology for estimating truck volumes.
Incorporating these new procedures will allow this 2014 report to become a benchmark of comparison for future study years, as well as allow future year-over-year comparisons. Additionally, the ever-growing nature of ATRI’s truck Global Positioning System (GPS) and truck financial data allows the research team to expand the analysis beyond the IHS. While the National Highway System (NHS) is the primary focus of the analysis as its usage is more consistent, a high-level analysis of local road congestion was also conducted and is described later in this report. Finally, it is important to note that due to the changes utilized in standardizing the methodology for future studies, the figures presented in this report are not directly comparable to those of the previous Cost of Congestion study.
METHODOLOGY
Four data sources were used in this analysis to quantify the impact of traffic congestion on the trucking industry:
- (1) Commercial truck travel times from the Federal Highway Administration (FHWA) National Performance Management Research Data Set (NPMRDS);
- (2) Commercial truck volumes from FHWA’s Freight Analysis Framework (FAF);
- (3) Commercial truck GPS data from ATRI’s Freight Performance Measures (FPM) database; and
- (4) Industry financial data from ATRI’s annual An Analysis of the Operational Costs of Trucking publication.
Roadway Network
The NPMRDS network, published as a shape file in each monthly iteration of the NPMRDS, was utilized as the foundational network in this analysis. The network is made up of over 308,000 bi-directional roadway segments, the bulk of which are located in the U.S. (with some segments falling in Canada, Mexico, and Puerto Rico). Each roadway segment is identified by a unique traffic management channel (TMC) code, and each TMC contains information on various jurisdiction levels (country, state, county), the length in miles of the segment, the road name, the road direction, the route type, and the latitude and longitude of the center of the segment.
The first step in defining the roadway network was to extract only those TMCs corresponding to roads located within the 48 contiguous states as well as Alaska and Hawaii. This resulted in the network depicted in Figure 1.
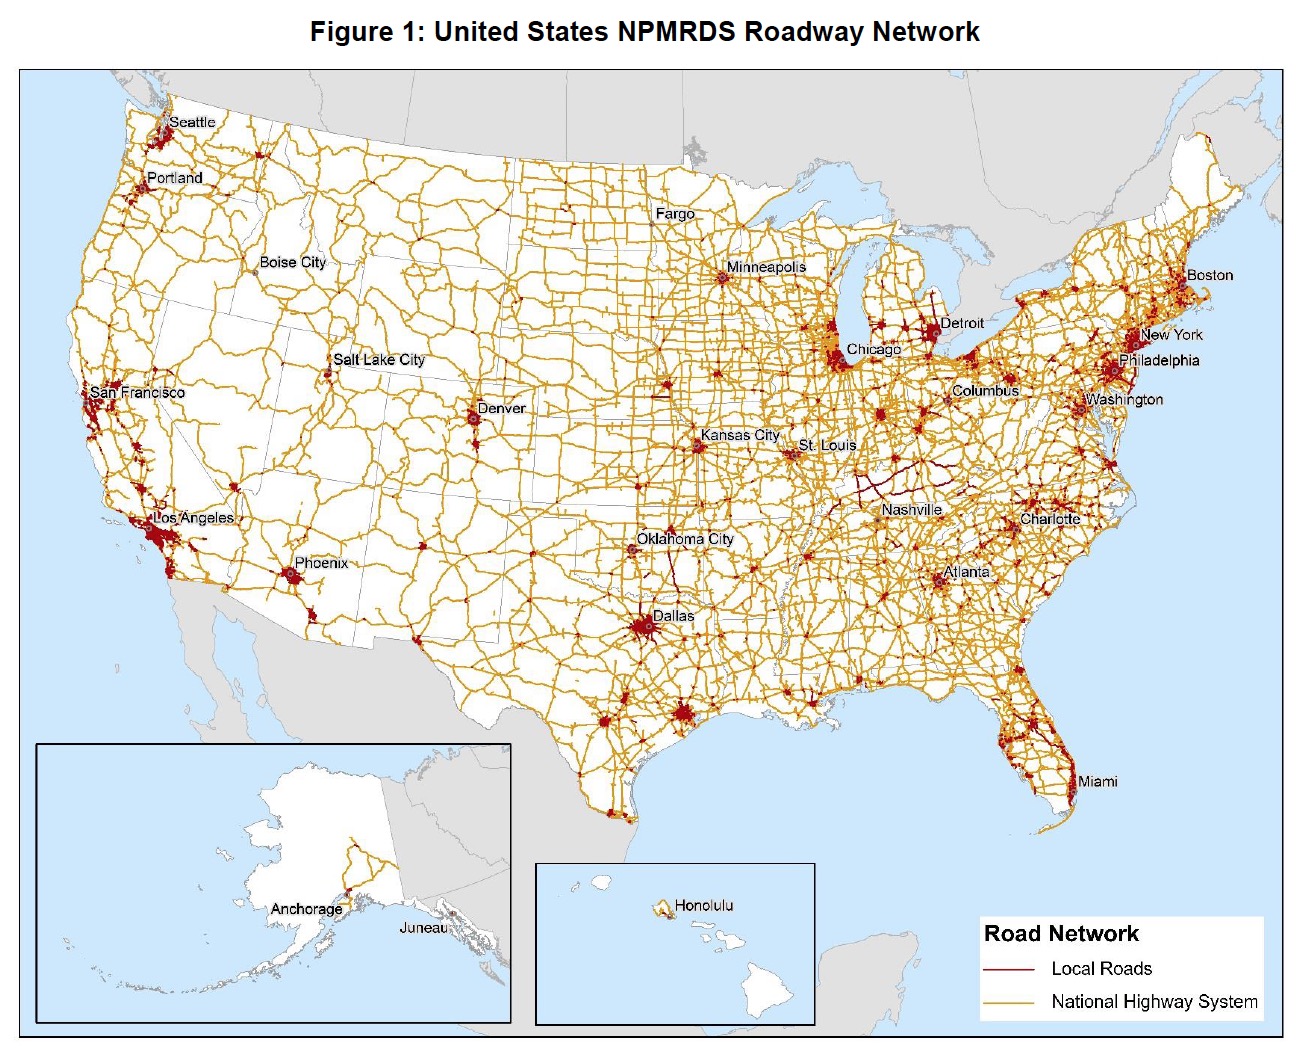
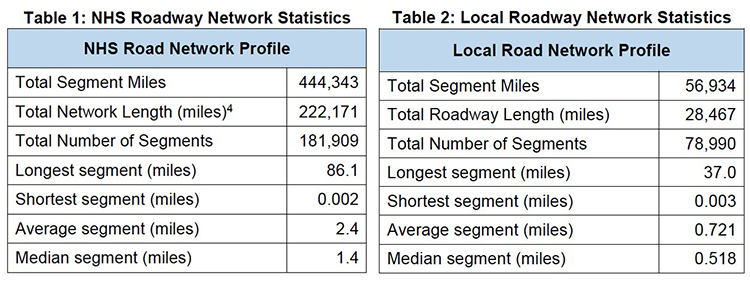
Next, using a combination of the route type indicator and the road name, the NHS was defined and extracted from the full U.S. network for use in this analysis. This network consists of numbered interstate, federal, state, and county highways. Detailed in Table 1, this generated just under 182,000 roadway segments, totaling over 444,000 bi-directional miles.
As noted, local roads were also examined in this analysis. These are roads with conventional street names and are predominantly found in urban areas. Highlighted in Table 2, this network accounted for approximately 80,000 additional segments and approximately 57,000 additional bi-directional miles.
Finally, the entirety of the network was spatially joined using ArcGIS software to reflect a variety of features including metropolitan area, county, and time zone for use in subsequent steps in this analysis.
Download full version (PDF): Cost of Congestion in the Trucking Industry
About the American Transportation Research Institute
atri-online.org
The American Transportation Research Institute (ATRI), a well-known leader in transportation-related research, is an organization whose hallmark is innovative thinking, critical analysis and uncompromised excellence. As part of the American Trucking Associations (ATA) Federation, ATRI benefits from the broad support of the ATA and its members.
Tags: American Transportation Research Institute, ATRI, Traffic, Trucking
 RSS Feed