


Earlier this year I argued that the up-front cost of local transportation projects, like light rail and bus rapid transit, aren’t really comparable to the cost of California’s high speed rail system. While all of these investments are fighting for the same dollars to some degree, their long-term balance sheets look very different: Local transit typically requires a persistent operating subsidy, whereas even the low-ridership estimates for high speed rail forecast a consistent operating profit. As a result, longer time horizons favor high speed rail, as profits gradually eat away at the high initial capital costs required to build out the network.
Unfortunately, the existing literature on California’s high speed rail project doesn’t take the long view. The official source for HSR’s cost, revenue, and ridership projections – the California High Speed Rail Authority’s 2014 Business Plan – limits its analysis to a 35-year operational period, from approximately 2025 to 2060. Much of the rail infrastructure, however, including some of the most expensive aspects of the project such as tunnels, viaducts, and bridges, have 100-year lifespans. Other up-front costs, such as for right-of-way acquisition, will only require a single, one-time payment.
Given this reality, what we need is an analysis that accounts for a more complete utilization of assets – an analysis that can fully amortize the high up-front capital costs over their useful lifetimes and most accurately determine the extent to which California HSR revenues can cover not just operational costs, but also those of capital. The analysis below will look at costs and revenue over a full 100-year period, at which point even the longest-lasting rail infrastructure will require full replacement. The spreadsheet analysis on which this is based can be found here. (Note that this analysis is ultimately just a simple extrapolation, unmindful of whatever technical constraints official analysts are required to work within.)
It’s not my intent that the project live or die by its economics, any more than a bikeway or subway line (or a highway) should be discarded just because it doesn’t earn money. High speed rail has countless side benefits, including improved connections between California’s major cities, reduced emissions in the heavily-polluted Central Valley and reduced air and road congestion throughout the state, job creation, more sustainable growth near stations, preservation of valuable agricultural land, and reduced car dependence. All of these benefits have been reported at length by writers like James Fallows and Robert Cruickshank, and they’re all important to the final “go/no-go” determination. The purpose here is to expand our perspective beyond the social, environmental, and mobility impacts of this project, to include the potential for long-term, direct fiscal benefits as well.
So, let’s get started.
CAPITAL COSTS
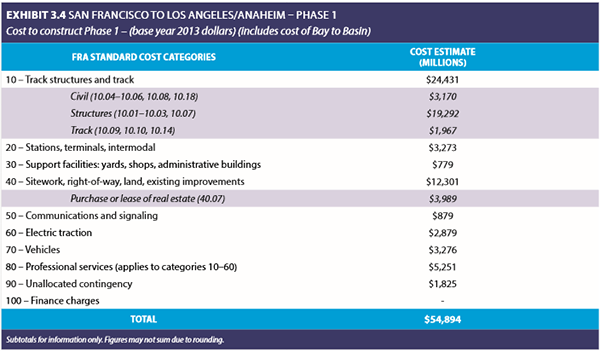
The California high speed rail project’s current capital cost estimate is $54.9 billion (all values reported here will be in 2013 dollars), contingent upon a variety of factors that haven’t yet been finalized, including whether the system will travel underground through the Angeles National Forest, or take a cheaper (but more circuitous) route between Palmdale and Los Angeles.
It’s fair to question whether the state and its contractors will be able to hold to this estimate. In an analysis of 258 mega-projects around the world, researcher Bent Flyvbjerg found that 9 out of 10 came in over budget, with an average cost overrun of 28 percent. But, as the chairman of the CA HSR Authority has himself noted, their team has put the project through an extremely rigorous risk assessment/management program, and it’s unlikely that any project in the country has undergone more outside scrutiny. In lieu of credible alternative estimates, we’ll have to take the word of the Authority and the independent panel of experts that oversee their work.
REVENUES
The estimated annual revenues from the 2014 Business Plan, for select years through 2060, are shown below:
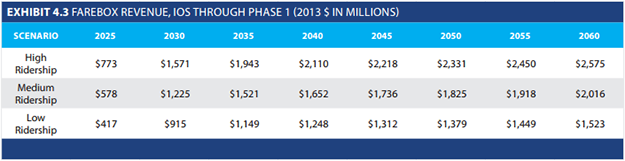
These numbers represent only farebox revenue, i.e., revenue from ticket sales; ancillary revenue sources such as advertising, concessions, and real estate interests are not included. After 2035, ridership, and therefore revenue, is expected to have reached 100% of its current potential – growth that follows is presumably the result of other factors, such as increased demand for travel and population growth. For this analysis we will use the Medium Ridership scenario, which corresponds to roughly the 50th percentile of potential ridership outcomes. The forecast assumes 5.1 percent growth over each five-year period through 2060 (about one percent per year).* Extrapolating this to the year 2125, farebox revenue is anticipated to total $3.849 billion ($3,849 million) in 2125.
Under this ridership scenario, cumulative revenue for years 2025 through 2125 is $240.7 billion. Ancillary revenue sources in other high speed rail markets have added 2 to 30 percent over and above farebox revenues, and it is conservatively estimated here that CAHSR will produce ancillary incomes of 5 percent above farebox. This brings cumulative revenues to$252.8 billion by the year 2125.
OPERATIONS AND MAINTENANCE COSTS
Operating costs represent the cost of running the high speed rail system, including labor, electricity, and general maintenance required to maintain a state of good repair for vehicles, tracks and track structures, stations, etc. It does not include the cost of major rehabilitation or replacement of capital resources, due either to significant unaccounted-for breakdowns or resources reaching the ends of their useful lives. These costs are accounted for in the “Lifecycle Costs” section of this analysis, found further below.
The estimated annual operations and maintenance costs from the 2014 Business Plan, for select years through 2060, are shown below:
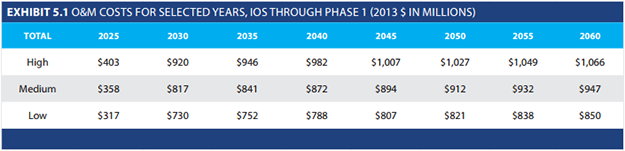
As with revenues, we’ll assume the Medium Cost scenario for this analysis. The forecast assumes 2.0 percent operations and maintenance cost growth over each five-year period (0.4 percent per year) through 2060.* Extrapolating this to the year 2125, O&M costs are anticipated to total $1.225 billion ($1,225 million) in 2125.
Under this scenario, cumulative operations and maintenance costs for years 2025 through 2125 are $100.2 billion by the year 2125.
LIFECYCLE COSTS
Lifecycle costs are those costs not covered under operations and maintenance, that include major rehabilitation and replacement of system infrastructure such as tracks, stations, tunnels, etc. Using the Business Plan’s “50-Year Lifecycle Capital Cost Model Documentation,” which describes the expected lifetime of all capital assets, anticipated rehabilitation schedules and costs, and replacement costs, I was able to extend this analysis to the year 2125. Where capital asset rehab and replacement costs are listed as a percentage of initial capital costs, values were taken from Exhibit 3.4 in the Business Plan.
Total lifecycle costs over this time period come to approximately $56.3 billion. This is almost certainly a conservative estimate, as the lifecycle costs through 2060 total $8.6 billion, a 22 percent premium over Business Plan estimates. (The Business Plan estimates a cumulative lifecycle cost of $7.0 billion by 2060.)
Because the 50-Year Lifecycle documentation provides limited line-item detail, and some longer-lived infrastructure lacked detailed rehabilitation and replacement cost estimates, various simplifying assumptions were made that tended to overestimate likely costs.**
SUMMARY
Below is a summary of these results, including additional sensitivity analysis to account for potentially slower increases in revenue growth, faster increases in costs, or both. Under the baseline circumstances described above, the state of California could realize a long-term profit of approximately $41 billion:
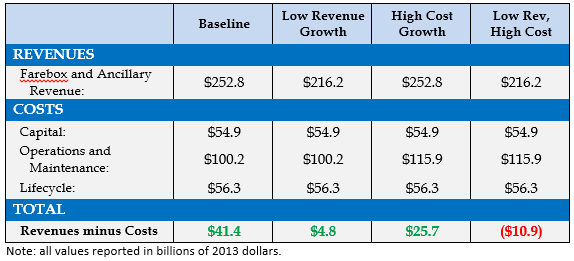
The low revenue scenario assumes slower revenue growth after 2060, with increases of just 2 percent, rather than 5.1 percent, every five years. The high cost scenario assumes faster O&M cost growth, with increases of 5 percent, rather than 2 percent, every five years. The Low Revenue, High Cost scenario combines these two scenarios. As you can see, only under the latter scenario does the state lose money, and even then it amounts to a loss of just $109 million per year – still enough to pay off the vast majority of capital costs. Compare this to what we would spend expanding our airports and roadway network in response to the state’s population growth and increased demand for intra-state travel, and even a slight loss on high speed rail looks pretty appealing.
This is, of course, far from the last word on the California high speed rail project’s economics. Numerous other scenarios are possible, including higher up-front capital costs, systemically lower ridership, or higher operations costs. This also doesn’t take into account the likelihood of private partnerships and financing costs, which will almost certainly divert some profits away from the state. That said, there’s no reason to believe things couldn’t actually turn out better for the state – these are just median projections, after all. We’ve certainly been surprised by above-average ridership on local transit throughout the country, from Seattle to Tucson to LA itself. Looking this far into the future, it’s impossible to know exactly how things will shake out.
In the end, the point is that we’re not building a high speed rail network for 35 years of use. It’s a much longer-term investment in California’s future that could be in operation for a century or more. The project’s benefits are to be enjoyed by residents and visitors to California throughout that period – not just fiscal benefits, but environmental, mobility, health, and social – so we should take care to examine its costs over the same timeline.
*Note that, because all values are reported in 2013 dollars, inflation will result in higher cost and revenue growth in nominal terms.
**Some simplifying assumptions for the lifecycle cost estimate:
- The project is completed in phases from 2022 to 2028, but this analysis averages these phases out, assuming the capital lifecycle clock starts ticking in 2025.
- Capital equipment in “Category 30 – Support Facilities, Yards, Shops, Administration Buildings” did not provide rehabilitation costs as a share of total up-front capital costs for that category (example: total capital costs for the category were $779 million; rehabbing the overhead catenary might cost 2% of that total), rehabilitation schedules varied between 20 and 30 years, and lifespans tended to meet or exceed 50 years. To simplify, it was assumed that all components in this category would be rehabilitated after 20 years at 100% of initial capital costs, rehabbed again 20 years later at 50% of initial capital costs, and replaced 10 years later at 100% of initial capital costs.
- Similar assumptions were made for categories 50 and 60.
- It was assumed that the number of train sets would increase by 50 percent in 2085 and double by 2115.
- Pedestrian, bicycle, car, and bus access (including roads) rehab and replacement data was not provided in the 50-Year Lifecycle documentation, so it was very conservatively estimated that this would cost $500 million. With rehabilitation every 10 years and replacement every 50 years, this alone added $3 billion to the 100-year lifecycle costs for the project.
…
About Shane Phillips
www.betterinstitutions.com
“I grew up in the suburbs of Seattle, got my driver’s license the day I turned 16, and rarely visited the city because driving in it was so unpleasant. Seven years later I moved to Seattle and realized the problem wasn’t the city, but how I chose to get around in it. I’m currently pursuing my Masters in Public Administration and Urban Planning at the University of Southern California in Los Angeles, and working on behalf of more sustainable, safe, healthy, economically productive cities.”
Tags: Better Institutions, CA, California, HSR, Shane Phillips
 RSS Feed