


GOVERNORS HIGHWAY SAFETY ASSOCIATION (GHSA)
Executive Summary
GHSA analyzed bicyclist fatal crash data resulting from a collision with a motor vehicle from 1975 to 2015 using the National Highway Traffic Safety Administration’s (NHTSA) Fatality Analysis Report System (FARS) to identify changes in trend lines associated with who is being killed, when and where those crashes are more likely to occur and why.
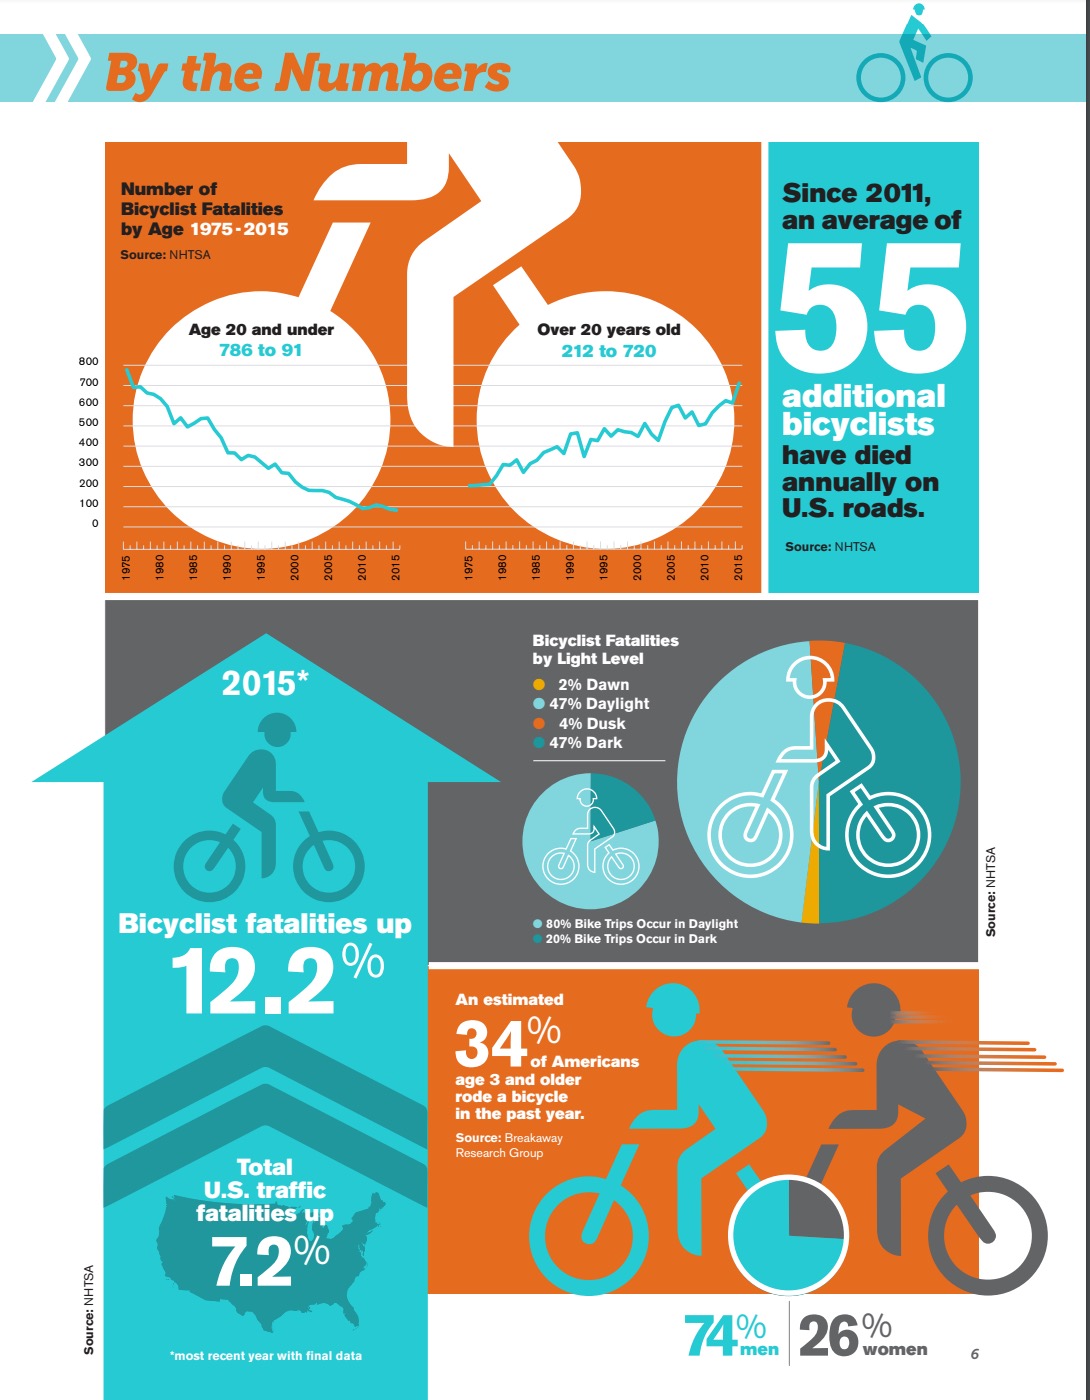
Bicyclist fatalities had been declining steadily, hitting an all-time low of 621 in 2010. Since then, however, the trend line has been moving in the wrong direction; in 2015, 818 bicyclists were killed on U.S. roadways, a 12.2% increase over the previous year and the largest uptick in two decades. Bicyclists have consistently accounted for at least 2 percent of all roadway fatalities.
Adults rather than children are now more likely to die in a bicyclist-motor vehicle crash. Today, adults account for 88 percent of bicyclist fatalities, with the average age being 45. Male bicyclists are almost six times more likely to be killed than female cyclists, a finding that has remained unchanged since 1975.
As to where and when these fatal bicyclist-motor vehicles crashes are occurring, 70 percent take place in urban settings and 72 percent at locations not at an intersection. While these crashes are fairly evenly distributed between daylight and darkness (47 percent each), the fact that 80 percent of cycling trips take place during daylight hours points to the increased risk for riding at night.
Bicycle-motor vehicle crashes are often the result of the motorist failing to notice the bicyclist. Riders, on the other hand, are more likely to see the vehicle and expect the driver to give way. When they do not, bicyclists often cannot stop in time to avoid a crash. Attentiveness is critical for safely sharing the road. In 2015, bicyclists accounted for 2.2% (79) of the 3,477 roadway users killed in a distraction-related crash. This number is likely underreported, since a third of drivers say they are distracted for at least a minute in about one in ten trips. A smaller number of bicyclists also admit to being distracted, with approximately 9 percent reporting the use of a cell phone or other mobile device on nearly all of their cycling trips.
Alcohol is also a factor for both bicyclists and drivers involved in bicycle-motor vehicle fatal crashes. In 2015, 22 percent of the fatally injured cyclists and 12 percent of the motorists in these crashes had blood alcohol content (BAC) level of .08 or higher. Additionally, 27 percent of all bicyclists killed in these crashes had a BAC of .01 or higher. While these numbers have declined for both groups, they have not fallen as dramatically for bicyclists as they have for drivers. On the other hand, alcohol-impaired driving fatalities involving either a car or truck driver or motorcycle operator accounted for 29 percent of all roadway fatalities in 2015.
The FARS data also revealed that 54 percent of the bicyclists killed in 2015 were not wearing a helmet, a proven countermeasure for preventing serious and fatal head injuries for cyclists of all ages in the event of a crash or fall.
Taking a three “E” approach – engineering, education and enforcement – is needed to make gains in bicyclist safety. While infrastructure improvements (engineering) are key, behavioral-related initiatives (education and enforcement) must work in tandem with the built-environment to ensure the safety not only of bicyclists, but all roadway users. GHSA is calling on states and their partners to consider 30 recommendations that address planning, resource allocation, education and training, public outreach, policy and technology.
Introduction
Happy 200th birthday, bicycle! Invented by German Baron Karl von Drais in 1817, the first human-powered, two-wheel bicycle – a velocipede – featured a steering mechanism, but no pedals. Cyclists generated power by running and pushing with their feet. Nearly fifty years would pass before the bicycle was pedal-operated. Also noteworthy is that the bicycle was born out of the need to provide an alternative to the primary form of transportation of the day – the horse. That fact is probably lost on the generations who have grown up with the automobile and learned to ride a bicycle purely for recreational purposes. However, people who bike, just like people who drive and walk, do so for a variety of reasons, including transport.
And therein lies the rub, this mix of modes shares a roadway system that presents challenges for all users, particularly bicyclists and pedestrians. This struggle, however, is not a 21st Century phenomena. The first bicycle crash reportedly occurred in 1842 when a Scottish cyclist knocked down a young girl. Fortunately, the child was unhurt; the bicyclist, on the other hand, was fined five shillings (The British Broadcasting Company, 2014). In the U.S., New York City has the dubious distinction of being the site of the first bicycle-motor vehicle crash. It occurred on May 30, 1896, when the operator of a “horseless wagon” appeared to “lose control… confusing [a] bicyclist” (Robbins, 2014). The cyclist suffered a fractured leg, while the “motorman” was “locked up in the police station” (Robbins, 2014).
Fast forward to 1975 – the first year that U.S. crash data was captured via the Fatality Analysis ReportingSystem (FARS). While motor vehicle occupants accounted for the largest share of the 44,525 people killed on the nation’s roadways (69 percent), 1,003 bicyclists died as well, representing 2 percent of all lives lost. Advances in roadway design and vehicle technology, coupled with stronger laws, high visibility enforcement and education have helped to reduce the number of roadway deaths since then. But even when U.S. motor vehicle fatalities dropped to an all-time low of 32,479 in 2011, bicyclists continued to account for 2 percent (680) of all roadway deaths in that year (Insurance Institute for Highway Safety [IIHS], 2017).
As the U.S. grapples with a 7.2% uptick in roadway fatalities (35,092) in 2015 (the latest year for which a full data set is available), the news is particularly troubling for bicyclists. Not only did bicyclists as a percentage of crash deaths remain stubbornly unchanged at 2.3 percent, but they represented the largest increase in fatalities (12.2%) when compared to all roadway user groups. During this 12-month period, 818 bicyclists died on U.S. roadways, the largest number since 1995 (National Highway Traffic Safety Administration [NHTSA], 2017a).
Why hasn’t the percentage of bicyclists killed on U.S. roadways decreased? The simplest explanation may be the lack of protection afforded to bicyclists and the difference in mass when they collide with a motor vehicle. This results in asymmetric risk – bicyclists are likely to sustain a serious injury; the vehicle occupants are not (Ragland as cited in Williams, 2014). Also, noteworthy is the impact weather can have on bicycling. A mild winter, for example, can change bicycling patterns, resulting in increased exposure risk from motor vehicle crashes. Another factor is the economy – more traffic fatalities tend to occur with low unemployment and low gas prices (NHTSA, 2016).
Changes in exposure may also be due to the increase in popularity of bicycling because of its health and environmental benefits. It is estimated that 34 percent of Americans (103.7 million) three years of age and older rode a bicycle in the past year (Breakaway Research Group, 2015). While most rode for recreational purposes, bicycle commuting is also increasing, although the U.S. continues to lag behind other countries in the percentage of people who commute by bike (McKenzie as cited in Williams, 2014). Even so, according to the latest U.S. bicycling and walking benchmarking report, the percentage of adults biking to work has increased from 0.4% in 2005 to in 0.6% in 2013. The increase is more significant in large cities, which saw commuting by bicycle increase from 0.7% to 1.2% during this same time period (Alliance for Biking & Walking [ABW], 2016).
Bike share programs are also helping to spur the growth in U.S. cycling, as the number of systems has increased from four in 2010 to 55 in 2016, with users logging 88 million trips over the past six years. In 2016 alone, bike share riders took over 28 million trips; that is equivalent to Amtrak’s annual ridership and tops visits in a single year to Walt Disney World (National Association of City Transportation Officials [NACTO], 2016a). Despite this unprecedented growth, it is important to note that there have been only two deaths associated with bike share programs.
Ridership to and from school by youth under 16 years of age is also making a rebound, albeit more slowly. According to the National Center for Safe Routes to School (NCSRTS), the percentage of students who biked to and from school fell below 2 percent from 2009 through 2011. Since then, however, it has increased to 2.2% and stabilized (NCSRTS, 2016).
Millennials, born between 1979 and 1995, may also be contributing to increased bicycle ridership. They are more likely than the previous two generations to choose a less car-centric lifestyle, to prefer living in a city and to identify city neighborhoods as their “ideal neighborhood” type, trends associated with lower levels of car dependence (Pew Research Center, Transit Center, & Dutze et al., as cited in ABW, 2016). Finally, it is estimated that 20 to 30 percent of today’s older teens (Generation Z) have not yet obtained a driver’s license (Shults et al., 2015; The Children’s Hospital of Philadelphia [CHOP], 2016), which may also be fueling biking trips.
Download full version (PDF): A Right to the Road
About the Governors Highway Safety Association
www.ghsa.org
GHSA is a 501(c)(3) nonprofit representing the state and territorial highway safety offices that implement federal grant programs to address behavioral highway safety issues. GHSA has two tiers of membership: its core State Highway Safety Office (SHSO) Members and Associate Members.
Tags: Bicycling, Biking, Cycling, GHSA, Governors Highway Safety Association, safety, State Farm
 RSS Feed