


REASON FOUNDATION
Executive Summary
Reason Foundation’s Annual Highway Report has tracked the performance of the 50 state-owned highway systems from 1984 to 2016. The 24th Annual Highway Report ranks the performance of state highway systems in 2016, with congestion and bridge condition data from 2017. Each state’s overall rating is determined by rankings in 13 categories, including highway expenditures per mile, Interstate and primary road pavement conditions, urbanized area congestion, bridge conditions and fatality rates. The study is based on spending and performance data state highway agencies submitted to the federal government. This study also reviews changes in highway performance over the past year.
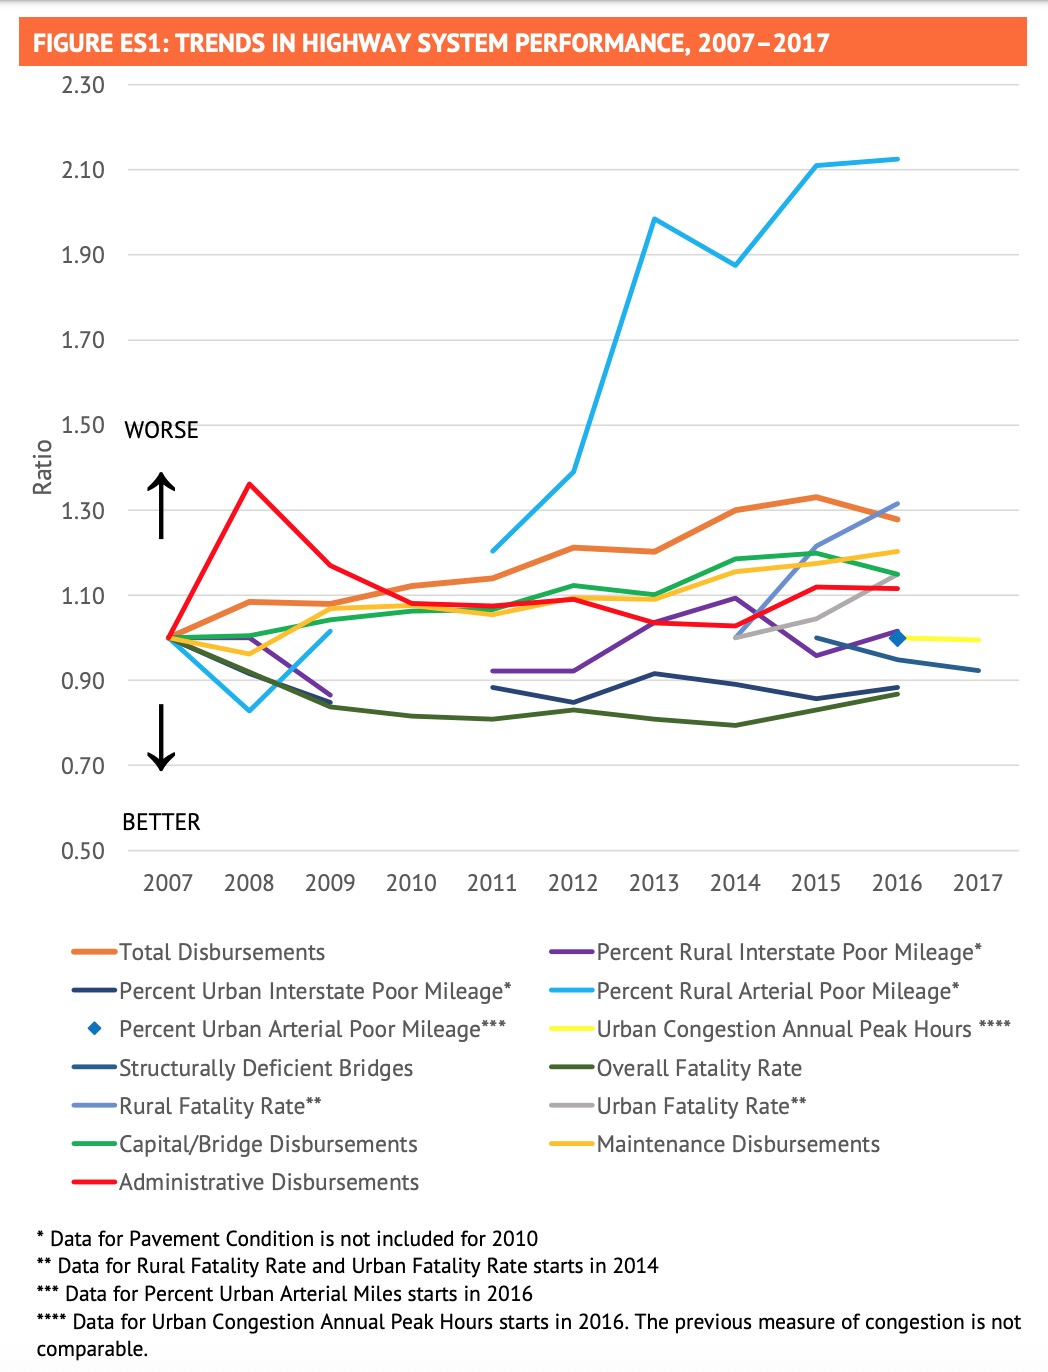
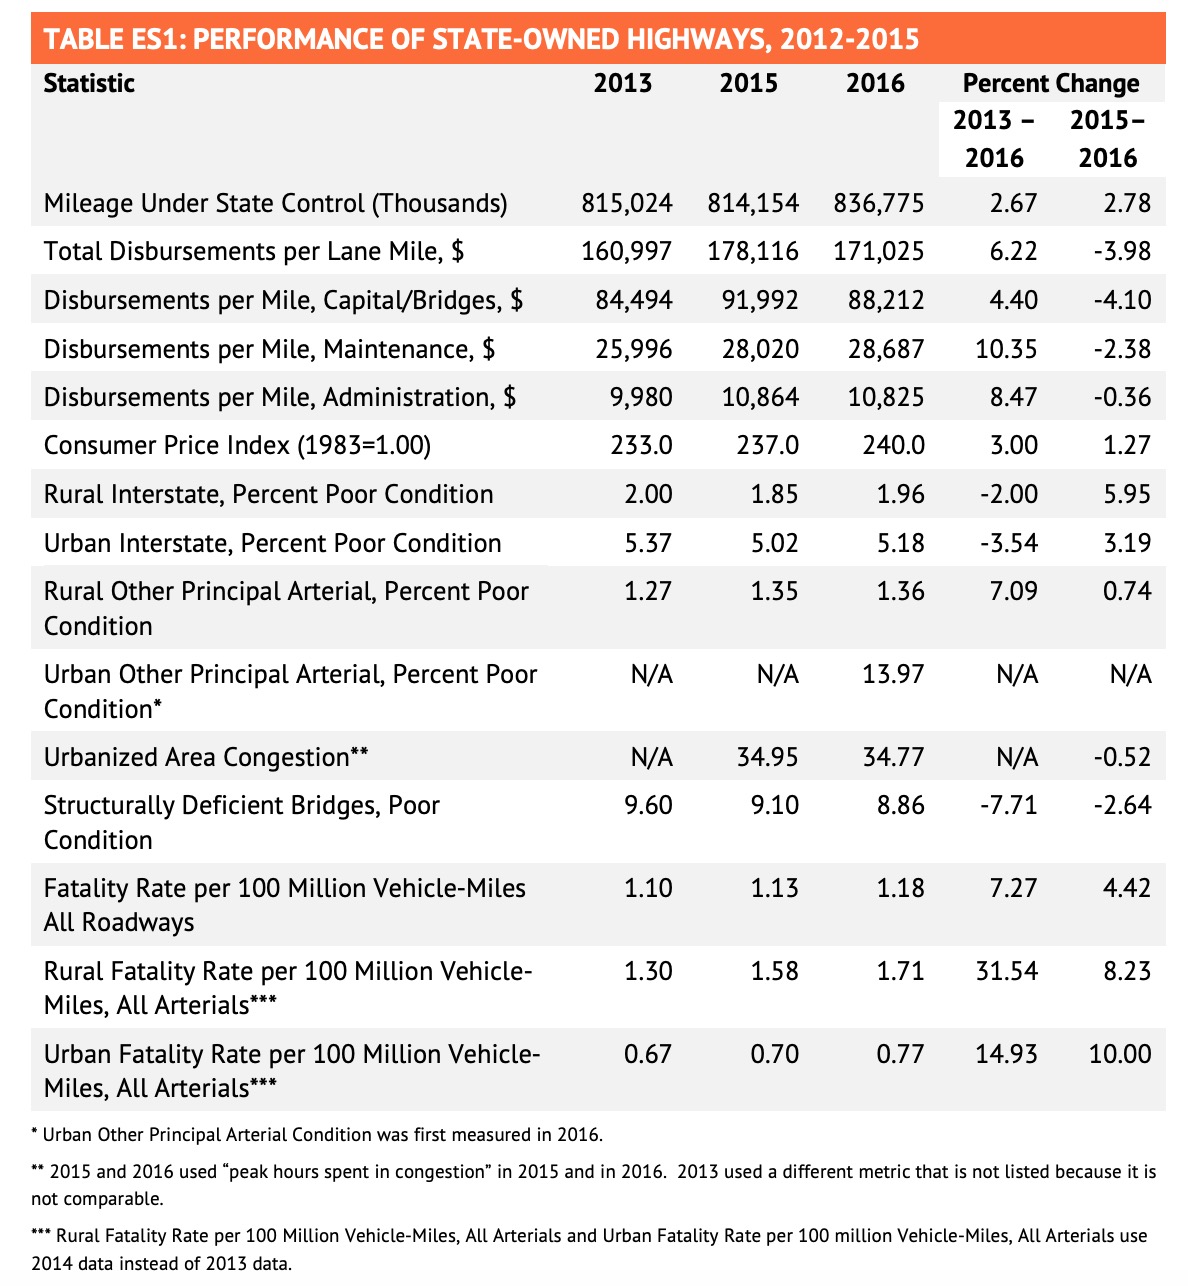
Although individual state highway sections (roads, bridges, pavements) steadily deteriorate over time due to age, traffic and weather, they are improved by maintenance and reconstruction. As a result, system performance can improve even as individual roads and bridges deteriorate. Table ES1 summarizes recent system trends for key indicators. Despite a decades-long trend of steady, incremental improvement, from 2013 to 2016, the overall condition of the total system has worsened. The four disbursement measures for the U.S. state-owned highway system improved between 2015 and 2016 (states expended fewer dollars on their highway systems in 2016 than in 2015). However, six of the eight performance measures worsened, including all of the pavement rankings and all three fatality rate rankings. The significant increase in the fatality rate is particularly troubling. The structurally deficient bridges ranking improved significantly (a smaller percentage of bridges is structurally deficient) and urbanized area congestion improved slightly. The Urban Other Principal Arterial ranking is new to this year’s report.
States do not need to engage in a spending bonanza to improve their systems. But there is some evidence that a small increase in spending could yield a significantly better system.
Unlike prior years, the top-performing states tend to be a mix of high-population and lowpopulation states. Very rural states may have a slight advantage. While rural North Dakota led the rankings for the second year in a row, Virginia and Missouri, two of the 20 most populated states in the country, were 2nd and 3rd. Maine and Kentucky rounded out the top five states.
Several other states with major cities also fared well: Tennessee (7th), North Carolina (17th), and Ohio (18th).
At the bottom of the overall rankings are New Jersey, Alaska, Rhode Island, Hawaii and Massachusetts. States with large populations and small geographic areas may be at a slight disadvantage, but three of the five worst performing states rank in the bottom 10 in population.
System performance problems in each measured category seem to be concentrated in a few states:
- Almost a third (31%) of the rural Interstate mileage in poor condition is in just three states: Alaska, Colorado and Washington.
- A third (33%) of the urban Interstate mileage in poor condition is in just five states: Hawaii, Louisiana, Delaware, California and New York.
- A significant share (12%) of the rural primary mileage in poor condition is in just four states: Alaska, Hawaii, Rhode Island and Massachusetts.
- Almost half (45%) of the urban arterial primary mileage in poor condition is in just seven states: Rhode Island, California, Massachusetts, Washington, New Jersey, Nebraska and New York.
- Automobile commuters in 10 states spend more than the national average of 35 hours annually stuck in peak-hour traffic congestion: New Jersey, New York, California, Georgia, Massachusetts, Illinois, Maryland, Texas, Washington and Minnesota.
- Although a majority of states saw the percentage of structurally deficient bridges decline, five states report more than 18% of their bridges as structurally deficient: Rhode Island, Iowa, West Virginia, South Dakota and Pennsylvania.
- After decades of improvement, fatality rates are increasing and eight states have overall fatality rates of 1.5 per 100 million vehicle-miles travelled or higher: South Carolina, Mississippi, Kentucky, Alaska, Louisiana, Arkansas, Montana and Alabama.
- After decades of improvement, rural fatality rates are increasing and nine states have rural fatality rates of 2.0 per 100 million vehicle-miles traveled or higher: Hawaii, North Carolina, Florida, California, Mississippi, New York, Kansas, South Carolina and Oregon.
- After decades of improvement, urban fatality rates are increasing and 13 states have urban fatality rates of 1.0 per 100 million vehicle-miles traveled or higher: New Mexico, Arizona, Hawaii, Florida, Arkansas, Kentucky, South Carolina, Louisiana, Oklahoma, Alaska, Tennessee, Wyoming and Nevada.
While system performance is down overall this year, nearly half of the states (21 of 50) made progress in 2016 compared to 2015. However, a 10-year average of state overall performance data indicates that system performance problems are concentrated in the bottom 10 states. These states are finding it difficult to improve. There is also increasing evidence that higher-level road systems (Interstates, other freeways and principal arterials) are in better shape than lower-level road systems, particularly local roads.
Download full version (PDF): 24th Annual Highway Report
About Reason Foundation
reason.org
Reason Foundation advances a free society by developing, applying, and promoting libertarian principles, including individual liberty, free markets, and the rule of law. Reason Foundation was founded in 1978 and is a 501(c)(3) nonprofit organization completely supported by voluntary contributions from individuals, foundations, corporations, and the sale of our publications.
Tags: Highway Report, Reason Foundation, Reason Highway Report
 RSS Feed