


POST CARBON INSTITUTE
By David J. Hughes
Revisiting the U.S. Department of Energy Play-by-Play Forecasts Through 2040 from Annual Energy Outlook 2016
Introduction
U.S. gas production was thought to be in permanent decline as recently as 2005. The advent of shale gas over the past decade has, however, dramatically turned this around and increased production to all-time highs. Notwithstanding this, U.S. gas production peaked in mid-2015 and shale gas production peaked in early 2016, according to the Energy Information Administration (EIA). The question is: How fast and how much can production grow in the future given higher prices and a return to higher rates of drilling? Given that shale gas is the major source of hope for growing or even maintaining U.S. gas production, a view to the future of shale gas production is critical for establishing energy policy and avoiding unforeseen supply shortfalls.
EIA forecasts of gas production published in its Annual Energy Outlook (AEO) are viewed by industry and government policy makers as the best available assessment of what to expect in the longer term, with the EIA’s reference case typically viewed as the most likely scenario for future production. In the report Drilling Deeper, published in October 2014, I reviewed the credibility of the EIA’s Annual Energy Outlook 2014 (AEO2014) forecasts for the major U.S. tight oil and shale gas plays based on the fundamental geological characteristics of each play; I also developed alternate production forecasts for each of the major shale gas plays. The EIA’s AEO2014 reference case projection over-estimated gas recovery from 2014 to 2040 by 53% compared to the “Most Likely” Drilling Deeper case. AEO20155 and AEO20166 were 50% and 83% higher, respectively, than Drilling Deeper for the same period. The EIA projections are likewise considerably more optimistic than those of the University of Texas Bureau of Economic Geology (UTBEG) for the four plays it has assessed.
The EIA recently released AEO2016 and kindly provided the underlying play-by-play production estimates for shale gas that make up its reference case. This report compares the forecasts in AEO2016 to the “Most Likely” case in Drilling Deeper and to the AEO2014 and AEO2015 forecasts; such comparisons are instructive in evaluating the volatility of EIA estimates for the same plays in forecasts separated by just one year, which reflects on their likely long-term accuracy. This report also assigns an “optimism bias” of the EIA’s forecast for each play (summarized in Table 2, page 32).
Key Fundamentals
Key fundamentals used in projecting future production of shale gas plays in Drilling Deeper were:
- Rate of well production decline: Shale gas plays have high well production decline rates, typically in the range of 75-85% in the first three years.
- Rate of field production decline: Shale gas plays have high field production declines, typically in the range of 30-45% per year, which must be replaced with more drilling to maintain production levels.
- Average well quality: All shale gas plays invariably have “core” areas or “sweet spots” where individual well production is highest and hence the economics are best. Sweet spots are targeted and drilled off early in a play’s lifecycle, leaving lesser quality rock to be drilled as the play matures (requiring higher gas prices to be economic); thus the number of wells required to offset field decline inevitably increases with time. Although technological innovations including longer horizontal laterals, more fracturing stages, more effective additives, and higher volume treatments have increased well productivity in the early stages of the development of all plays, they have provided diminishing returns over time and cannot compensate for poor quality reservoir rock. The generally low gas prices in the past several years has led gas producers to focus on sweet spots, disproportionately depleting high-productivity drilling locations compared to the overall number of potential drilling locations in each play.
- Number of potential wells: Plays are limited in area and therefore have a finite number of locations that can be drilled. Once the locations run out, production goes into terminal decline.
- Rate of drilling: The rate of production is directly correlated with the rate of drilling, which is determined by the level of capital investment.
Overall Forecast Comparison to Past Years
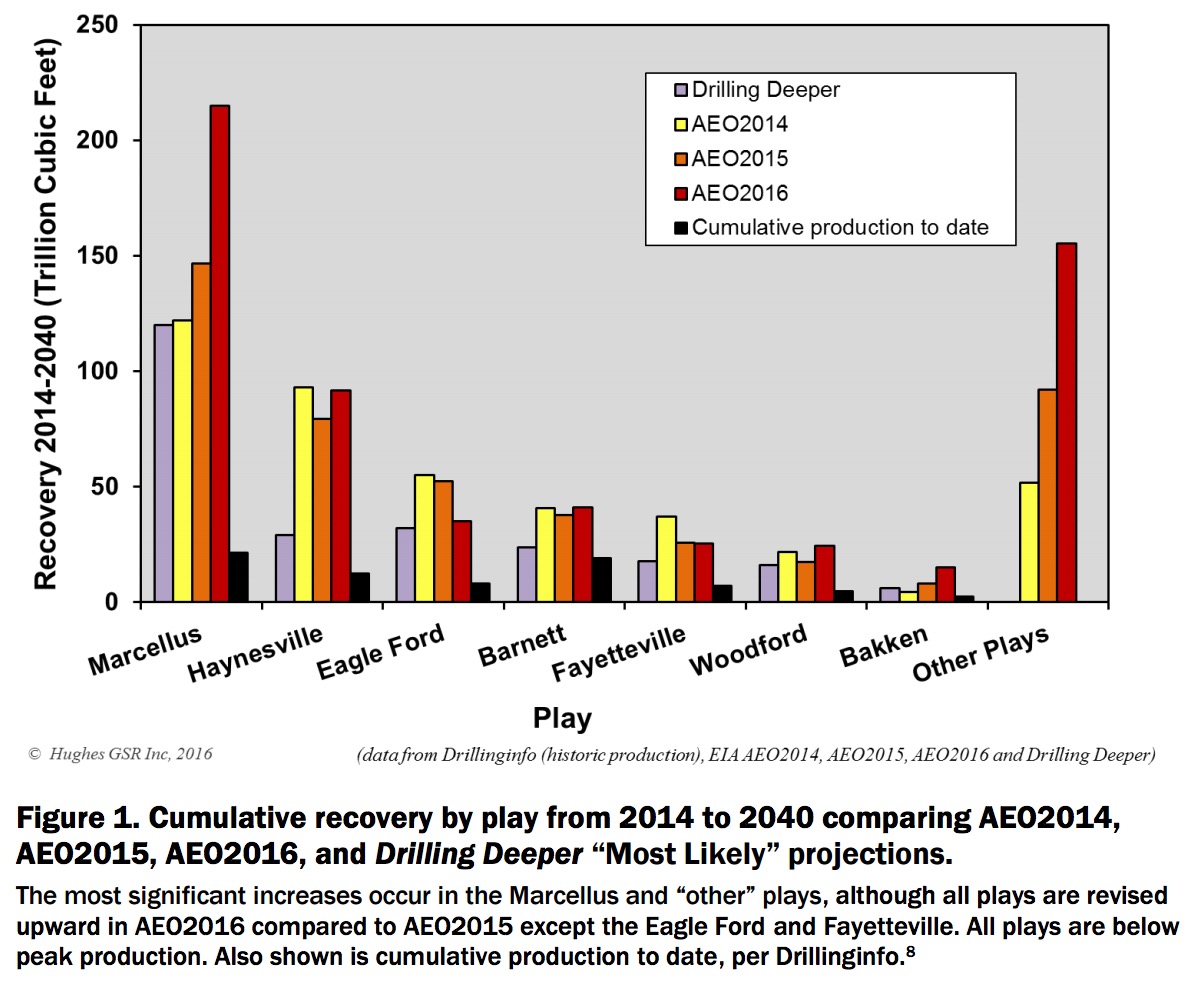
How have the EIA’s projections changed in 2016? Figure 1 compares cumulative production through 2040 in the AEO2016 projections to the “Most Likely” drilling rate forecasts in Drilling Deeper and to projections in AEO2014 and AEO2015, as well as to cumulative production to date. All plays have peaked in the past few years; the key questions are whether these peaks can be reversed with higher prices and drilling rates, and what the cumulative production over the forecast period is likely to be.
Some general observations with respect to the assumptions and projections in AEO2016:
- EIA assumes natural gas prices will remain at or below $5/MMbtu through 2040, when they will be $4.85/MMbtu ($2015). This is 20% below its AEO2015 price forecast over the 2015-2040 period. Gas prices at the time of writing were about $3.00/MMbtu and were over $12.00/MMbtu as recently as 2008.
- EIA assumes production from shale gas will grow much faster than projected in AEO2015, with 2014-2040 production increasing by 144 trillion cubic feet (Tcf), or 31%, over its 2015 projection.
- The seven major plays analyzed in Drilling Deeper, which constituted 89% of AEO2014 projected shale gas production through 2040, amount to just 74% of 2014-2040 production in the AEO2016 projection. Production is projected to grow aggressively in the Utica and other unnamed plays.
- Thirty-six percent of production through 2040 is projected to come from the Marcellus and 65% from just three plays—the Marcellus, Haynesville and Utica—highlighting yet again that high quality shale gas plays are not ubiquitous.
- Considering that AEO2015 and AEO2016 are just 12 months apart, there is a lot of change in projected production profiles for individual plays and total production—which raises questions about the robustness, or lack thereof, of the EIA’s forecasting methods.
Download full version (PDF): 2016 Shale Gas Reality Check
About Post Carbon Institute
www.postcarbon.org
Founded in 2003, Post Carbon Institute’s mission is to lead the transition to a more resilient, equitable, and sustainable world by providing individuals and communities with the resources needed to understand and respond to the interrelated ecological, economic, energy, and equity crises of the 21st century.
Tags: David J. Hughes, Drilling Deeper, EIA, Energy Industries Association, Natural Gas, Post Carbon Institute, Shale
 RSS Feed