


UNITED STATES ENERGY INFORMATION ADMINISTRATION (EIA)
U.S. energy-related carbon dioxide emissions decreased 1.7% in 2016
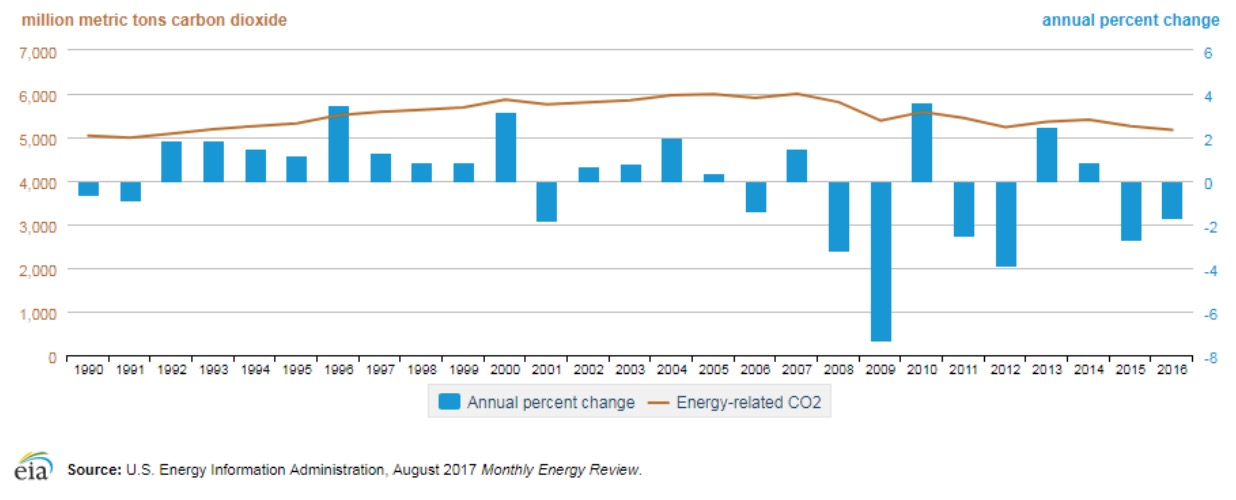
Energy‐related carbon dioxide (CO2) emissions decreased by 89 million metric tons(MMmt), from 5,259 MMmt in 2015 to 5,170 MMmt in 2016. Although real gross domestic product (GDP) increased 1.5% over that period, other factors contributing to energy-related CO2 emissions more than offset the growth in GDP, leading to a 1.7% decline in energy-related CO2.
These factors include the following:
A decline in the carbon intensity of the energy supply (CO2/British thermal units [Btu]) of 1.7% A 1.4% decline in energy intensity (Btu/GDP)
Combining these two factors, the overall carbon intensity of the economy (CO2/GDP) declined by 3.1%
Emissions have declined in 6 out of the past 10 years, and energy‐related CO2 emissions in 2016 were 823 MMmt (14%) below 2005 levels.
Figure 1. Energy-related CO2 emissions, 1990–2016
The decrease in energy‐related CO2 emissions in 2016 mainly reflected a decline in carbon intensity of the energy consumed
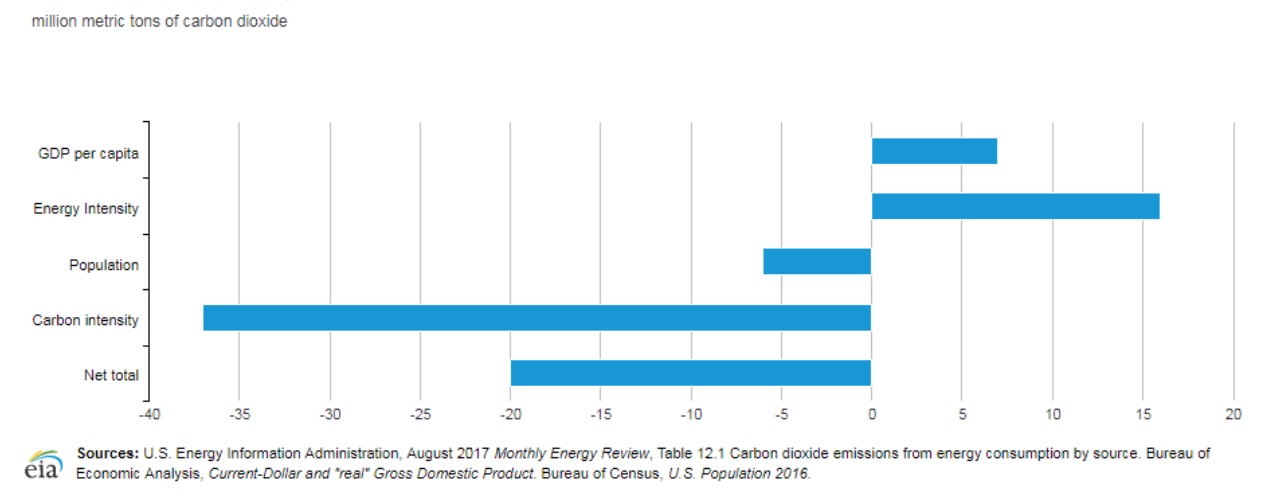
- In 2016, the carbon intensity of U.S. energy consumption declined by 1.7%. From 2005 to 2015, the average annual decline was 1.0%. As a result, energy-related CO2 emissions were 37 MMmt lower than where they would have been had the prior trend continued.
- Population growth of 0.7% —slightly lower than the 2005–15 annual average of 0.8%—put downward pressure on CO2 emissions growth, resulting in a 6 MMmt decline in CO2 emissions compared with the 2005–15 trend.
- Energy intensity added 16 MMmt of CO2 emissions, falling at a rate of 1.4%, compared with the higher 2005–15 annual average decline of 1.7% per year.
- Growth in GDP per capita also put upward pressure on CO2 emissions, adding about 7 MMmt compared with the 2005–15 trend.
- The net effect for 2016 was CO2 emissions that were about 20 MMmt lower than they would have been had components of the Kaya energy/carbon decomposition (shown in Figure 2) matched their 2005–15 trend rates.
Figure 2. Changes in CO2 emissions attributed to Kaya Identity factors from 2015 to 2016 compared with the trend from the prior decade
Natural gas CO2 emissions surpassed those from coal in 2016
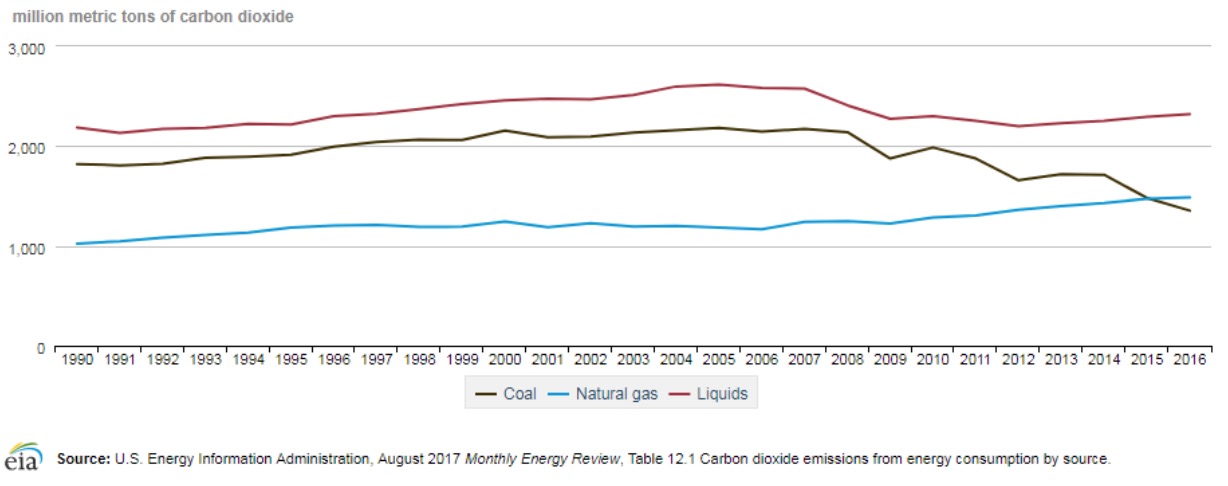
- CO2 emissions from petroleum and other liquids, which have been the largest source of energy-related CO2 in recent decades, have been increasing since 2012 after remaining relatively constant from 2004 to 2007 and then generally decreasing through 2012.
- Since the beginning of the 2007–09 recession, coal CO2 emissions have also generally declined. Although total coal CO2 emissions in 2016 were lower than those from petroleum and other liquids, coal is comparatively more carbon intensive, with more CO2 released per Btu of energy. The decline in coal CO2 emissions has contributed to a lower overall carbon intensity of U.S. energy consumption and kept emissions below pre-recession levels.
- Natural gas CO2 emissions have increased every year since 2009. The natural gas share of electricity generation has grown as the coal share declined, partially offsetting the decline in energy-related CO2 emissions from coal. Natural gas CO2 emissions surpassed those from coal in 2016. However, because natural gas produces more energy for the same amount of emissions as coal, growth in natural gas consumption contributed to the overall 2016 decline in total emissions.
Figure 3. Energy-related CO2 emissions by fuel, 1990–2016
Download full version (PDF): U.S. Energy-Related Carbon Dioxide Emissions, 2016
About the United States Energy Information Administration (EIA)
www.eia.gov
The U.S. Energy Information Administration (EIA) collects, analyzes, and disseminates independent and impartial energy information to promote sound policymaking, efficient markets, and public understanding of energy and its interaction with the economy and the environment.
Tags: carbon dioxide, CO2, EIA, Emissions, Energy Information Administration, Energy-related CO2 emissions, United States Energy Information Administration
 RSS Feed