ASSOCIATION OF AMERICAN RAILROADS
U.S. AND CANADIAN FREIGHT RAILROAD TRAFFIC
Who releases it and when?
- The Association of American Railroads (AAR) releases its Weekly Railroad Traffic report every Thursday morning. The report contains rail traffic data for the previous week. Weekly data are aggregated into monthly figures in Rail Time Indicators. When comparing year-over-year rail traffic, comparisons are always made to the period 52 weeks prior to the present period.
What is it and why is it important?
- The AAR traffic report details rail carloadings by railroad for 19 different major commodity categories, as well as intermodal units (truck trailers and shipping containers). Railroads reporting to the AAR collectively account for around 95% of total U.S. and Canadian freight traffic.
- Freight railroading is a “derived demand” industry — demand for rail service occurs as a result of demand elsewhere in the economy for the products railroads haul. Thus, rail traffic is a useful gauge of broader economic activity, especially of the “tangible” economy.
What are the latest numbers for U.S. railroads?
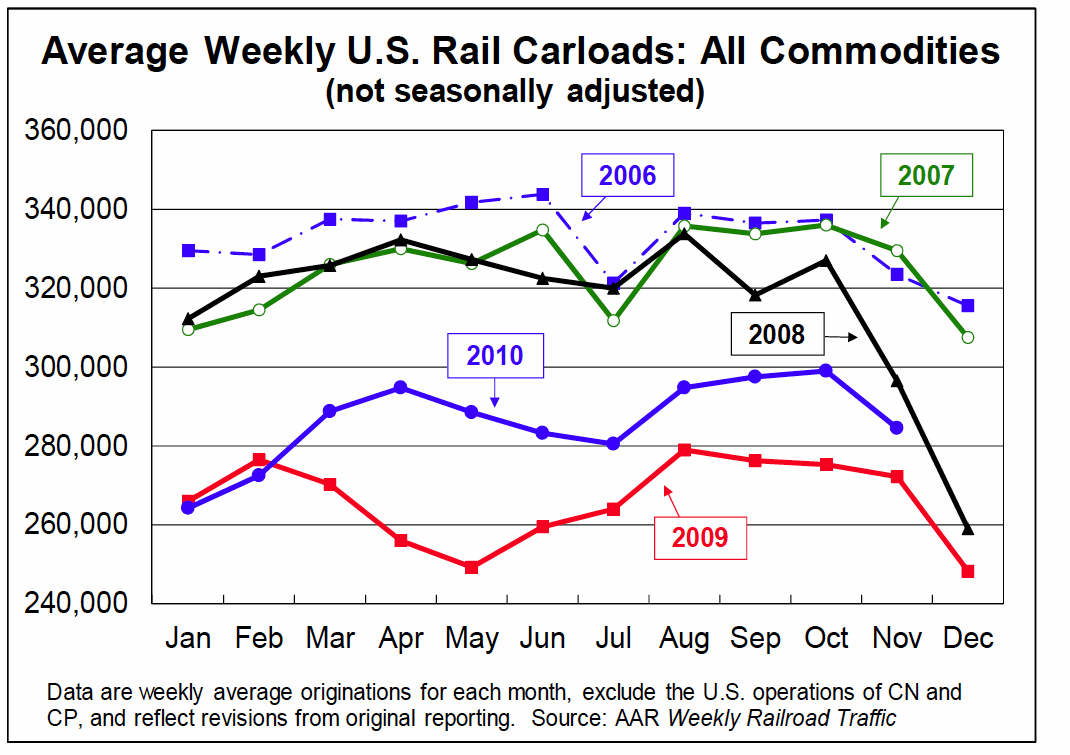
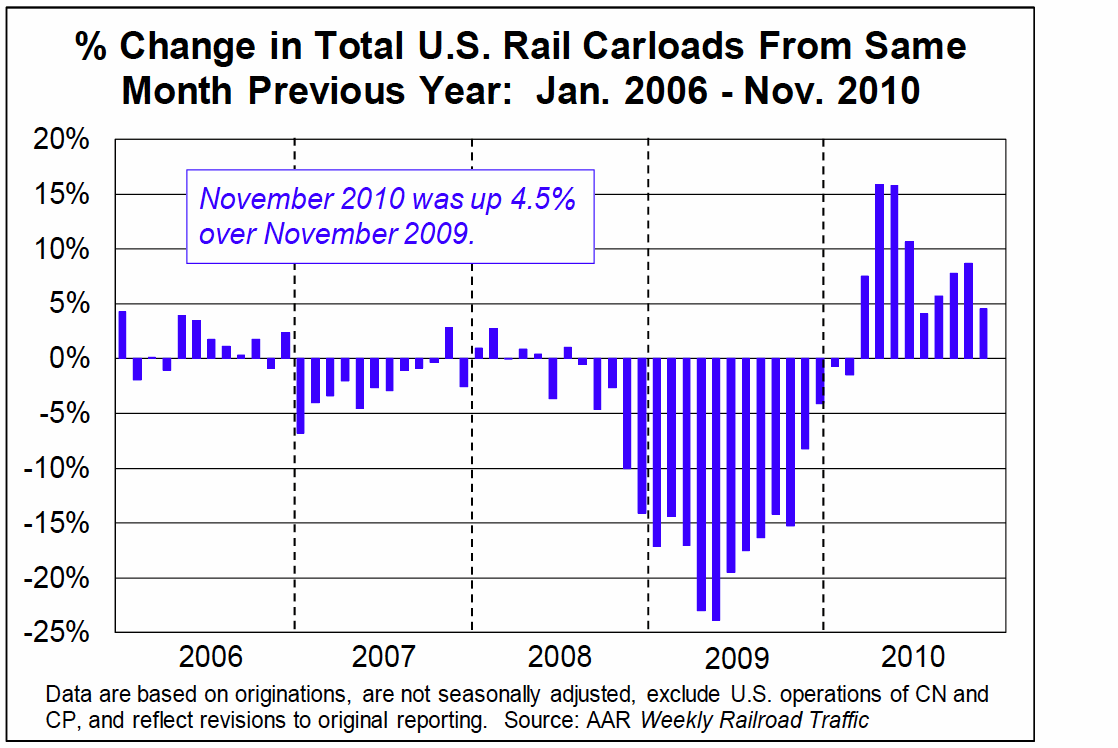
- U.S. freight railroads originated an average of 284,407 carloads per week in November 2010 (see chart below left), for a total of 1,137,626 carloads for the month. That’s up 4.5% over November 2009. November was the ninth straight month with higher year-over-year average weekly rail carloads (see chart below right), something that hasn’t happened since 2004.
- In previous editions of Rail Time Indicators, we compared monthly rail traffic in 2010 with rail traffic in the same month in 2009 and 2008. We included comparisons with 2008 because 2008 represented a more “normal” level of rail traffic than the severely depressed levels of 2009. However, as the chart above left shows, rail traffic plunged in November 2008 — so much so, in fact, that from this point forward, 2008 no longer represents a “normal” level of rail traffic. For those interested in 2008 comparisons, the tables on pages 5 , 6, and 7 still include 2008 data.
- November 2010 (On a seasonally adjusted basis, U.S. rail carloads were down 1.1% in November 2010 from October 2010 (see the top left chart on page 14). Seasonally-adjusted carloads on U.S. carriers have fallen (though by relatively small amounts) three of the past four months.2nd November 2009, for that matter) includes Thanksgiving week, which is always one of the lowest-volume weeks of the year for U.S. railroads. So far in 2010, only the week including January 1 and the week including the 4th of July have had lower traffic volumes than Thanksgiving week.
- On an unadjusted basis, 14 of the 19 commodity categories saw carload gains in November 2010 compared with November 2009. Traffic gains in November were led by many of the same commodity categories that have paced rail traffic gains for a number of months, including coal (up 2.9%, or 14,690 carloads); metallic ores (up 86.0%, or 14,561 carloads); crushed stone, sand, and gravel (up 18.7%, or 10,122 carloads); and primary metal products (mainly steel, up 26.0%, or 6,717 carloads). The tables and charts beginning on page 5 have more commodity detail.
- On a seasonally adjusted basis, U.S. rail carloads were down 1.1% in November 2010 from October 2010 (see the top left chart on page 14). Seasonally-adjusted carloads on U.S. carriers have fallen (though by relatively small amounts) three of the past four months.
- Year-to-date carloads through week 47 in 2010 (the end of November) were 13.46 million, up 7.1% from the 12.57 million through week 47 in 2009.
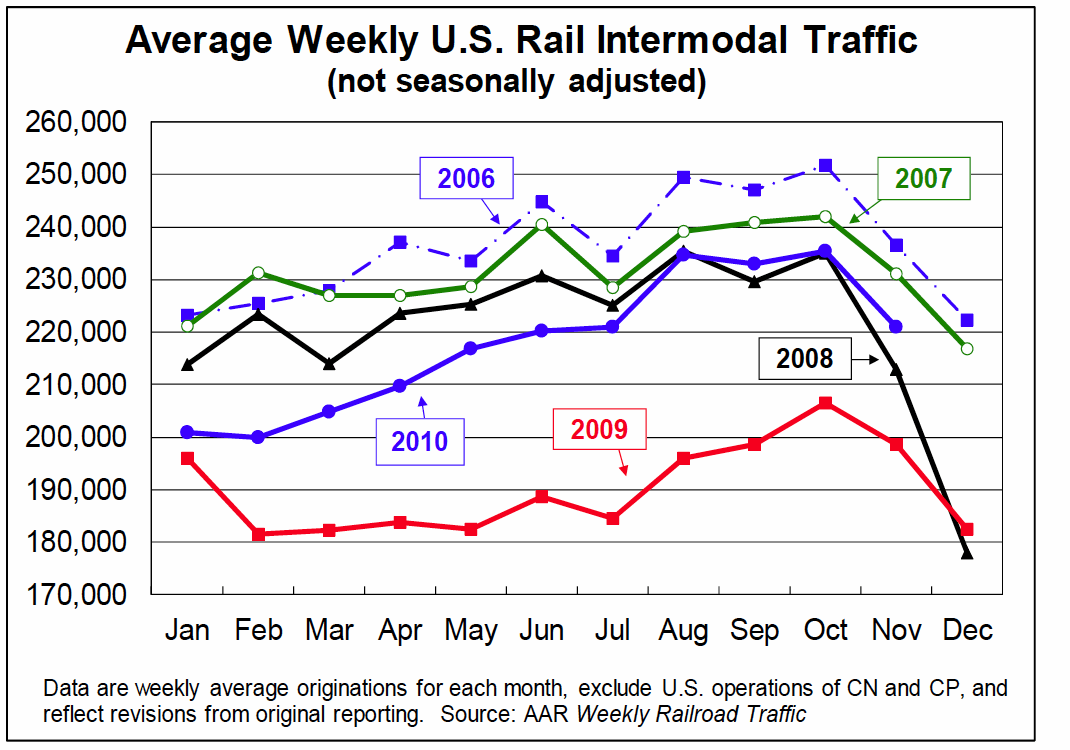
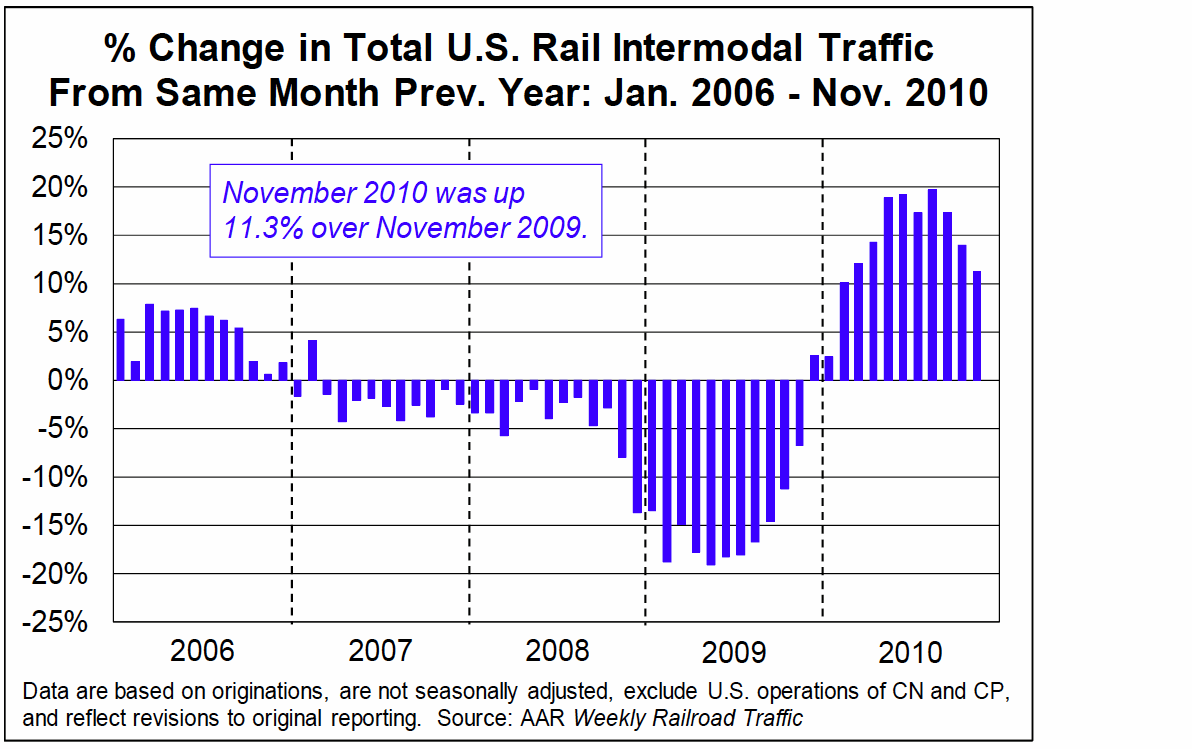
- In November, U.S. railroads originated 883,755 intermodal trailers and containers, an average of 220,939 per week — up 11.3% over November 2009.
- On a non-seasonally adjusted basis, there is always a big decline in intermodal traffic in November from October, partly because many of the goods retailers stock for holiday sales are shipped in September and October and partly because of Thanksgiving. The week including Thanksgiving this year was the lowest-volume intermodal week of the year for U.S. railroads.
- Year-to-date U.S. intermodal traffic through the end of November was 10.25 million trailers and containers, up 14.3% from the 8.96 million through week 47 in 2009.
- Seasonally adjusted U.S. rail intermodal traffic was down 0.4% in November 2010 from October 2010 (see top right chart on page 14), its third straight monthly decline. As with carloads, recent declines have been small.
- Combined U.S. carload and intermodal traffic has risen each month in 2010 (see chart bottom right of page 5). The last time combined traffic had risen 11 straight months was January 2006.
Download full executive summary (PDF): Rail Time Indicators, December 2010
About the Association of American Railroads
www.aar.org
“Our mission is to work with elected officials and leaders in Washington, D.C. on critical rail transportation issues to ensure that the railroads meet America’s transportation needs today and in the future.”


 RSS Feed