


MINETA TRANSPORTATION INSTITUTE
Taxis provide an alternative to conventional public transit services in many cities, and understanding the demand for taxis requires consideration of the role that taxis serve in the greater transportation system. This report presents the results of a study to model taxi demand across time and space, explicitly accounting for the presence and quality of transit service. The primary objective of the study was to identify the factors that drive taxi demand and to understand how this varies by location and time of day. This was accomplished by developing demand models for taxi trip generation and mode choice that explicitly account for the characteristics of transit service in the neighborhoods where trips are made. The resulting insights are useful for making regulatory, planning, and engineering decisions about how to manage taxi markets, accounting for their role in the transportation system.
A secondary objective of the study was to demonstrate how emerging “big data” from taxis and transit systems can be integrated with demographic, socioeconomic, and employment information to develop useful demand models. In particular, large sets of data that include records referencing specific times and locations provide a wealth of information that can be used to model and understand how demand varies across time and space. Ultimately, developing methods to systematically analyze and extract meaningful information from these large data sources will help improve the way transportation systems are monitored and managed.
The dataset includes records of every taxi trip in New York City over a 10-month period. The data was tracked by automatically operating Global Positioning System (GPS) receivers installed in each licensed taxi. Additional data sources included detailed transit schedule and routing information from transit agencies available online in the Google Transit Feed Specification (GTFS) format. Demographic, socioeconomic, and employment data were obtained from the U.S. Census Bureau at the spatial resolution of census tracts. By properly processing the data and integrating the various types of information in a Geographic Information System (GIS), it was possible to develop models that provide insights into the factors that determine the number of trips made by taxi. This study demonstrates the model for NYC, but the methods are general and can be applied to cities around the world where similar data is collected and available.
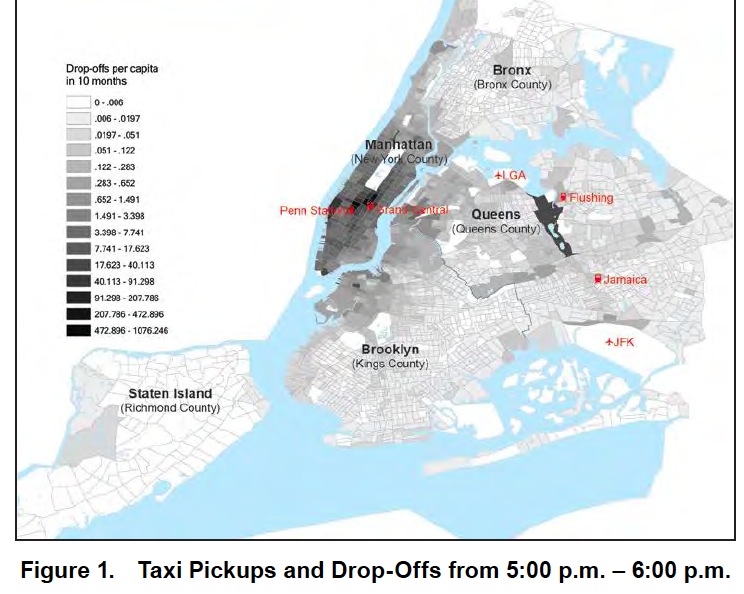
The study was conducted in two parts. First, a trip generation model was developed to identify location characteristics that determine the number of taxi trip origins (pickups) and taxi trip destinations (drop-offs) that are generated during each hour of the day. Second, a mode choice model was developed and analyzed to determine how the competitive appeal of taxi travel versus transit changes by time of day as the travel cost for each mode varies.
A trip generation model was developed as a hybrid cross-classification and regression model. Taxi demand and transit accessibility data were classified by hour of day. A separate regression model was then developed to estimate the number of taxi pickups and drop-offs in a census tract for each hour of the day. In order to fit these models, the different data sources had to be aggregated to the same spatial and temporal resolution. Since demographic, socioeconomic, and employment data is available at the level of census tracts, that was the spatial unit used for the analysis.
In order to account for the spatial and temporal variation of transit accessibility across the city, a method was developed to measure Transit Access Time (TAT) based on transit schedules. The TAT at a specific point and time represents the time that it would take a person to access the nearest transit departure, which includes walking to a transit station and waiting for the next departing vehicle. Detailed transit schedule information was extracted from a database of transit route and schedule records that are available from transit agencies in the GTFS format. Then a clustering algorithm was used to identify the minimum access time from a location, which may not be at the nearest station because a further station with more frequent service may provide better transit accessibility. The result is a quantitative measurement of transit accessibility that can be mapped to show variation across different locations in the city and used as an explanatory variable in the trip generation model.
The trip generation models that have been developed from these data reveal that there are six characteristics of a census tract that have the greatest explanatory power for estimating taxi demand:
- Transit accessibility
- Population size
- Median age
- Percent of population educated beyond bachelor’s degree
- Median income per capita
- Number of job opportunities (irrespective of residence)
An additional, detailed investigation of taxi demand within Manhattan shows that there are certain types of employment opportunities that are more correlated with taxi trips than others. The number of employees working in retail, accommodation and food service, and healthcare are the strongest determinants of the number of taxi trips. The magnitude of their influence also changes with the time of day, so patterns are revealed about how activities in NYC vary over the course of the day and which activities are most associated with taxi use. Although it is not possible to know the precise trip purpose without a traveler survey, these findings support the notion that people are more likely to use taxis when traveling to and from stores, hotels, restaurants, and hospitals. It appears that taxis and transit sometimes operate in competition and at other times are complements because both modes follow and influence the levels of activity in neighborhoods across the city.
The second part of the study focused on the costs of taxi and transit trips for a few specific origin-destination (OD) pairs. Using the data for NYC, the analysis looked at trips between Penn Station and each of the three major airports in the area: John F. Kennedy International Airport (JFK), LaGuardia Airport (LGA), and Newark Liberty International Airport (EWR). The taxi data reveals how travel time and fare varies for each OD pair by time of day. This was compared against the main non-driving alternative, public transit. A script was used to extract detailed, time-specific transit routes and access locations from the Google Maps API Transit Directions Service. These were used determine the waiting time, travel time, and fare for making the same trips, at the same times of day, as the taxi trips.
In the context of a mode choice analysis, the comparison of trip costs by taxi and transit show how the likelihood of travelers choosing one mode or the other changes over the course of the day. A sensitivity analysis is particularly useful in showing the tipping points at which the number of passengers traveling together in a group, or the value they place on their time, makes the additional expenditure for a taxi worthwhile. Typically transit is more competitive during the day when the frequency of service is high, especially during the morning and evening peaks when traffic congestion also slows taxis. Taxis are more competitive in the evening hours when traffic moves quickly and less frequent transit service imposes longer waiting times on travelers. In two cases, there was no trade-off observed: Transit is both faster and cheaper than taxis for trips to JFK during the afternoon peak and trips from JFK during the morning peak, when traffic congestion eliminates the competitive advantage of taxi speed.
The models and findings presented in this report are specific to NYC, because of the data sources used. The methods can be generally applied to any city in which similarly detailed data on taxi use and transit schedules are available. The models provide insights about both the spatial and temporal variation of taxi demand across the city. These models and insights are useful for designing taxi regulations and transit schedule improvements. The models also show how characteristics of a neighborhood and competing transit service affect the number of trips made by taxi.
Download full version (PDF): Modeling Taxi Demand with GPS Data from Taxis and Transit
About Mineta Transportation Institute
transweb.sjsu.edu
“The Mineta Transportation Institute (MTI) conducts research, education, and information and technology transfer, focusing on multimodal surface transportation policy and management issues. It was established by Congress in 1991 as part of the Intermodal Surface Transportation Efficiency Act (ISTEA) and was reauthorized under TEA-21 and again under SAFETEA-LU. The Institute is funded by Congress through the US Department of Transportation’s (DOT) Research and Innovative Technology Administration, by the California Legislature through the Department of Transportation (Caltrans), and by other public and private grants and donations, including grants from the US Department of Homeland Security.”
Tags: GPS, GPS Data, Manhattan, Mineta Transportation Institute, New York City, NYC, Taxis
 RSS Feed