


THE PEW CHARITABLE TRUSTS
Overview
Cities in the United States play a substantial role in funding critical infrastructure with investments in capital projects such as roads, bridges, schools, and libraries. For example, all local governments accounted for 35 percent of total highway and transit spending from 2008 through 2012. To pay for these projects, cities often sell bonds on the municipal market.
In the years following an economic downturn, governments commonly increase borrowing in order to take advantage of low interest rates and meet needs that may have been deferred because of tight budgets. However, an analysis by The Pew Charitable Trusts finds that borrowing in 30 large U.S. cities since the end of the Great Recession, which ran from late 2007 through mid-2009, was notably different from past recoveries. Through 2014—some five years after the national recession’s end—new money bond issuances across these cities dipped to their lowest point in over 20 years.
The large cities analyzed experienced significant drops in revenue during the recession, and the fiscal recovery that followed has proved uneven. Continuing strains on revenue may have led cities to move cautiously when considering new bond issuances and taking on additional debt service payments. Large funding gaps for pensions and what are known as Other Post-Employment Benefits, mostly retiree health benefits, also may have played a role in restraining borrowing in some local governments.
To understand borrowing activity in the 30 key cities, Pew analyzed inflation-adjusted calendar year data from the Thomson Reuters SDC Platinum database covering municipal issuances over the last three recessions and the recovery periods that followed. A review of the data finds that:
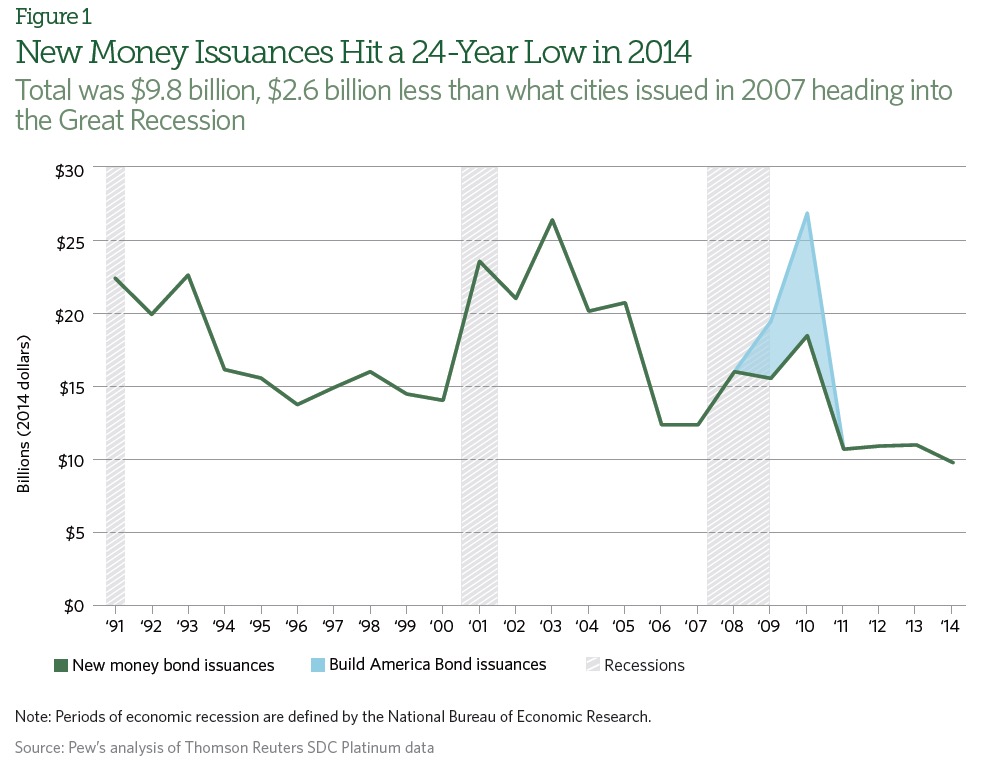
- In 2014, new money bond issuances in the 30 cities hit their lowest point in a 24-year period that started in 1991. This was contrary to usual borrowing patterns following economic downturns. Sales of new money bonds typically rise during a recovery as interest rates are often low, but from 2010 through 2014 total new money issuances for these cities averaged only $12.2 billion annually. These same cities issued an average of $17.6 billion a year in the five years following the 1990-91 recession and $20.1 billion a year in the five years after the 2001 recession.
- In 2014, the 30 cities analyzed issued $9.8 billion in new money bonds, compared with $12.4 billion in 2007 as the nation headed into the Great Recession. Not all issued new money bonds, but of those that did the amount sold varied widely, from $6.5 million in Tampa, Florida, to $1.5 billion in Chicago. Three cities alone, Chicago, Los Angeles, and Washington, accounted for over 40 percent of the total new money bond issuances in the 30 cities.
- Refinancing of bonds, known as refunding, totaled $9.2 billion in 2014—nearly half (49 percent) of total bonds issued. Since 2011, refunding has consistently exceeded 40 percent of bond issuances in the cities.
2014 saw record low issuances
The market for new money bonds has been sluggish despite the economic recovery. In 2014, all municipal bond issuances nationwide totaled $337.5 billion, down $91.6 billion from 2007, the year the Great Recession started. The largest U.S. cities were no exception to this trend. In 2014, 30 of these cities issued only $9.8 billion in new debt, about 21 percent lower than issuances in 2007, and a record low for a 24-year period starting in 1991. Annual bond sales for 2011 through 2013 had been only marginally higher, reflecting a persistent trend.
Though new money issuances were low overall in 2014, there was considerable variation among cities that issued these bonds, reflecting their differing fiscal conditions, state contexts, and local priorities. For example:
- Chicago issued $1.5 billion in debt, the highest amount of any of the 30 cities. About half—$784 million— of the total was in airport revenue bonds for improvements to Chicago Midway International Airport. The remainder was distributed across a range of projects, including infrastructure and transportation improvements, grants to nonprofit organizations, and assistance for other governmental units and school districts.
- Los Angeles issued $1.4 billion in new money bonds, the second-highest amount of the cities examined. Most of this new debt came from a single $1.36 billion tax and revenue anticipation note. Rather than borrowing for infrastructure or other capital improvements, the city used proceeds from this bond to smooth its revenue and prepay some pension contributions, resulting in $35 million in savings.
- The third-highest issuer, Washington, borrowed $1.2 billion. Among the bonds issued were $350 million in 100-year maturity “century bonds” for improvements to outdated storm water and sewage infrastructure to reduce pollution of area waterways and improve water quality.
- Several other cities made smaller issuances. For example, St. Louis sold $65 million in tax and revenue anticipation notes in order to improve city cash flow. In Pittsburgh’s first new money issuance since 2003, the city received $50 million in net proceeds to fund future capital projects such as roads and bridges.
Five cities issued no new money bonds: Detroit; Sacramento, California; San Diego; Phoenix; and Riverside, California. Detroit had no bond sales in 2014 and was still in bankruptcy until December of that year.
Download full version (PDF): Issuance of New Money Bonds Remains Low in Large U.S. Cities
About the Pew Charitable Trusts
www.pewtrusts.org
From its first day in 1948, Pew’s founders steeped the new institution with the entrepreneurial and optimistic spirit that characterized their lives. As the country and the world have evolved, we have remained dedicated to our founders’ emphasis on innovation. Today, Pew is a global research and public policy organization, still operated as a non-partisan, non-governmental organization dedicated to serving the public.
Tags: Bonds, cities, Financ, Money Bonds, Pew Charitable Trusts, Pew Trusts
 RSS Feed