


NEW YORK CITY DEPARTMENT OF HEALTH AND MENTAL HYGIENE
 People who are physically active are more likely to live longer, healthier lives. New Yorkers get more of their physical activity through active transportation, such as walking or cycling, than from recreational activities, such as exercise or sports participation. New Yorkers are more likely to walk to work compared with the national average, and a recent New York City (NYC) Department of Transportation report shows that cycling is becoming more popular; the most recent annual 12-hour count of cyclists crossing the East River bridges increased from 2,041 cyclists in 2000 to 15,394 in 2015.
The amount of cycling in a city may be influenced by many factors such as cost, secure bicycle storage, and neighborhood conditions, including access to bike lanes, parks, and safe streets. This report provides information about the characteristics of cyclists in NYC and how cycling has changed from 2007 to 2014, overall and by neighborhood.
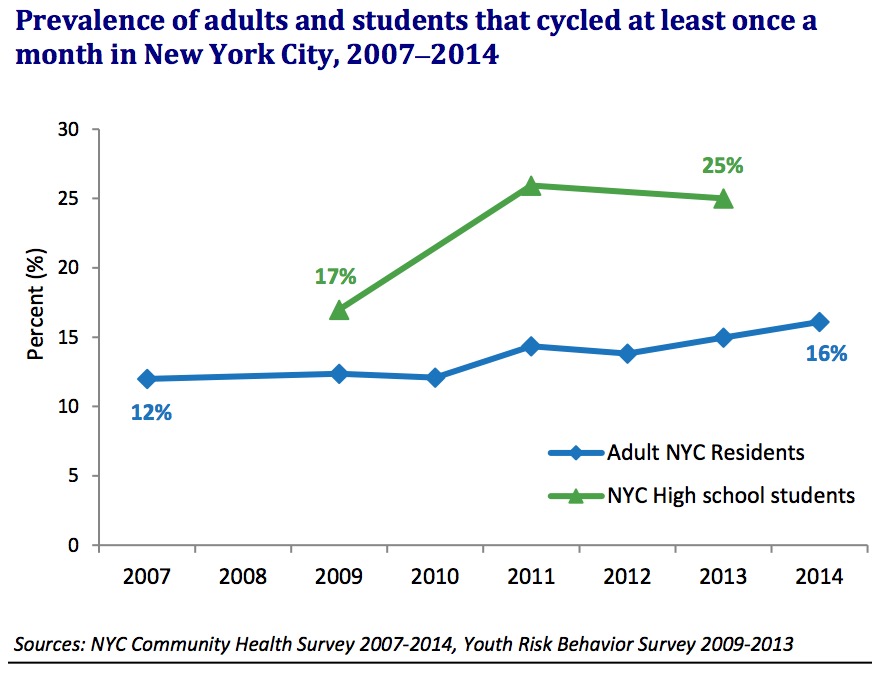
More New York City residents report cycling once a month or more
- From 2007 to 2014 there was an increasing trend in the prevalence of NYC adults who cycled at least once a month (12% to 16%).
- The prevalence of students who cycled at least once a month also increased, to 25% in 2013 from 17% in 2009.
Prevalence of cycling once a month or more increased in most boroughs
- From 2007 to 2014, there was an increase in the prevalence of adults who cycled once a month or more among residents of Manhattan (12% to 22%), Brooklyn (12% to 16%), Queens (12% to 15%), and Staten Island (10% to 13%). There was no change in the prevalence of adult residents who cycled once a month or more in the Bronx.
- The prevalence of adult residents who cycled once a month or more increased in eight NYC neighborhoods between 2007 and 2014: four neighborhoods in Manhattan (Washington Heights 8% to 19%; East Harlem 6% to 21%; Upper East Side-Gramercy 9% to 23%; Union Square-Lower Manhattan 15% to 26%), two in Brooklyn (Bedford Stuyvesant-Crown Heights 8% to 17%; Flatbush 8% to 15%) and one each in the Bronx (Fordham 8%* to 14%) and Staten Island (Northern Staten Island 9% to 14%). The prevalence in all other neighborhoods did not change during this period.
- The prevalence of cycling at least once a month or more increased among students living in each of the five boroughs from 2009 to 2013 (Brooklyn, 17% to 25%; the Bronx, 14% to 21%; Manhattan, 14% to 29%; Queens, 19% to 26%; Staten Island, 19% to 25%).

Cycling has increased in wealthier households
- Cycling once a month or more increased from 2007 through 2014 among adult residents with low (13% to 21%) and medium household poverty (9% to 15%), but not among those with high or very high household poverty.
- The difference, or gap, between prevalence of cycling once a month or more among adult residents of low poverty households compared with very high poverty households increased from 2007 to 2014.
Cycling has increased across all neighborhood poverty levels
- The prevalence of adult residents cycling once a month or more increased across all levels of neighborhood poverty (low poverty, 14% to 20%; medium, 12% to 16%; high 12% to 15%; and very high poverty 10% to 13%) from 2007 to 2014. The difference between these groups (on average 4.2% lower prevalence in low compared with very high poverty neighborhoods) is similar across the years.
- Cycling once a month or more increased among adults in two of three areas where the Health Department’s Center for Health Equity is establishing Neighborhood Health Action Centers (see note). The prevalence of cycling once a month or more increased between 2007 and 2014 among residents of East and Central Harlem (8% to 20%) and North and Central Brooklyn (12% to 16%); there was no change among residents of the South Bronx.
Download full version (PDF): Cycling in New York City, 2007-2014
About the New York City Department of Health and Mental Hygiene
nyc.gov/health
“With an annual budget of $1.6 billion and more than 6,000 employees throughout the five boroughs, we’re one of the largest public health agencies in the world, serving 8 million New Yorkers from diverse ethnic, cultural and economic backgrounds. With over 200 years of leadership in the field, we’re also one of our nation’s oldest public health agencies.”
Tags: Bicycling, Cycling, Health, New York City, New York City Department of Health and Mental Hygiene, NYC
 RSS Feed