


UNITED STATES CENSUS BUREAU
INTRODUCTION
For many Americans, access to computers and high-speed Internet connections has never been more important. We use computers and the Internet to complete schoolwork, locate jobs, watch movies, access healthcare information, and find relationships, to name but a few of the ways that we have grown to rely on digital technologies. Just as our Internet activities have increased, so too have the number of ways that we go online. Although many American households still have desktop computers with wired Internet connections, many others also have laptops, smartphones, tablets, and other devices that connect people to the Internet via wireless modems and fixed wireless Internet networks, often with mobile broadband data plans.
As part of the 2008 Broadband Data Improvement Act, the U.S. Census Bureau began asking about computer and Internet use in the 2013 American Community Survey (ACS). Federal agencies use these statistics to measure and monitor the nationwide development of broadband networks and to allocate resources intended to increase access to broadband technologies, particularly among groups with traditionally low levels of access. State and local governments can use these statistics for similar purposes. Understanding how people in specific cities and towns use computers and the Internet will help businesses and nonprofits better serve their communities as well.
The Census Bureau has asked questions in the Current Population Survey (CPS) about computer use since 1984 and Internet access since 1997. While these estimates remain useful, particularly because of the historical context they provide, the inclusion of computer and Internet questions in the ACS provides estimates at more detailed levels of geography. The CPS is based on a sample of approximately 60,000 eligible households and estimates are generally representative only down to the state level. Computer and Internet data from the ACS, based on a sample of approximately 3.5 million addresses, are available for all geographies with populations larger than 65,000 people and will eventually become available for most geographic locations across the country.
This report provides household and individual level information on computer and Internet use in the United States. The findings are based on data collected in the 2013 ACS, which included three relevant questions shown in Figure 1. Respondents were first asked whether anyone in the household owned or used a desktop computer, a handheld computer, or some other type of computer. They were then asked whether anyone connected to the Internet from their household, either with or without a subscription. Finally, households who indicated connecting via a subscription were asked to identify the type of Internet service used, such as a DSL or cable-modem service.
HIGHLIGHTS
- In 2013, 83.8 percent of U.S. households reported computer ownership, with 78.5 percent of all households having a desktop or laptop computer, and 63.6 percent having a handheld computer (Table 1).
- In 2013, 74.4 percent of all households reported Internet use, with 73.4 percent reporting a high-speed connection (Table 1).
- Household computer ownership and Internet use were most common in homes with relatively young householders, in households with Asian or White householders, in households with high incomes, in metropolitan areas, and in homes where house-holders reported relatively high levels of educational attainment (Table 1).9
- Patterns for individuals were similar to those observed for households with computer ownership and Internet use tending to be highest among the young, Whites or Asians, the affluent, and the highly educated (Table 2).
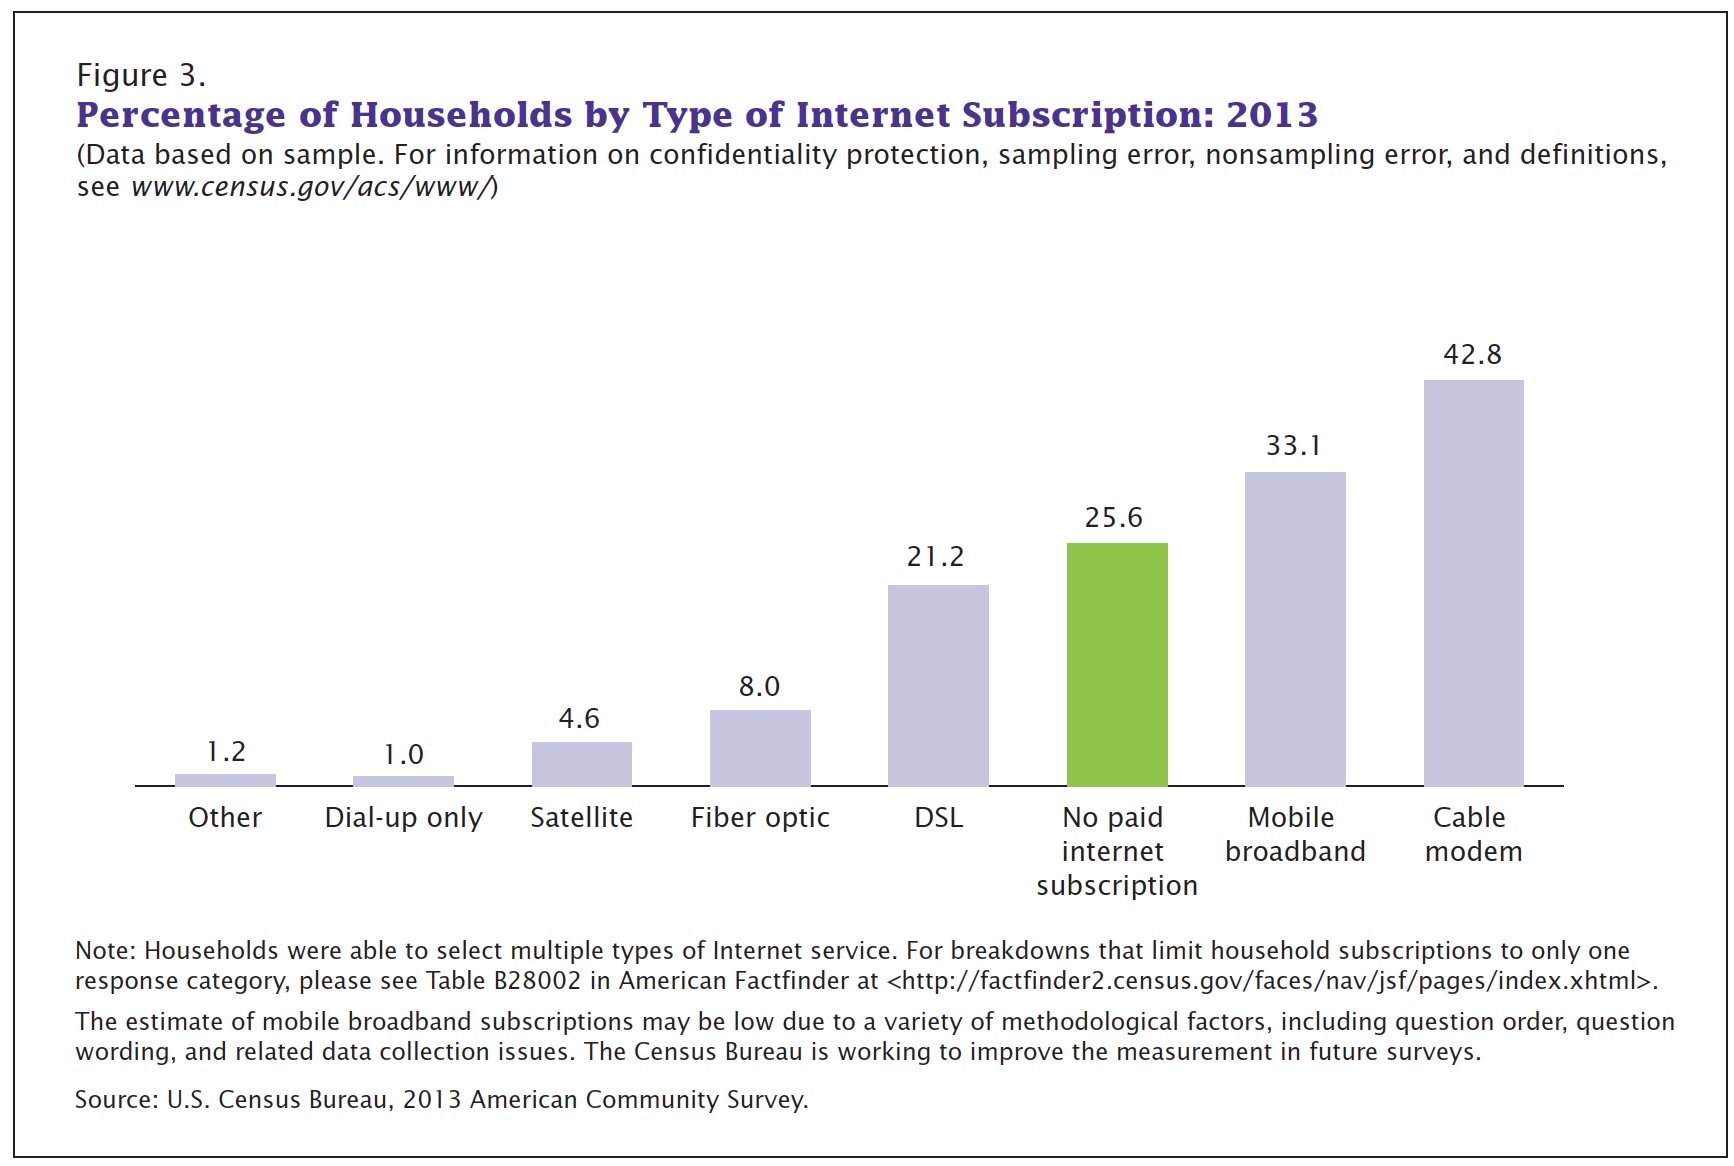
- The most common household connection type was via a cable modem (42.8 percent), followed by mobile broadband (33.1 percent), and DSL connections (21.2 percent). About one-quarter of all households had no paid Internet subscription (25.6 percent), while only 1.0 percent of all households reported connecting to the Internet using a dial-up connection alone (Table 3).
- Of the 25 states with rates of computer ownership above the national average, 17 were located in either the West or Northeast. Meanwhile, of the 20 states with rates of computer ownership below the national average, more than half (13) were located in the South (Table 4).
- Of the 26 states with rates of high-speed Internet subscriptions above the national average, 18 were located in either the West or Northeast. Meanwhile, of the 20 states with rates of high-speed Internet subscriptions below the national average, 13 were located in the South (Table 4).
- Overall, 31 metropolitan areas had rates of computer ownership above the national average by at least 5 percentage points. Of these metropolitan areas, most were located in the West, while only 2 were located in the South (Figure 5).
- Overall, 59 metropolitan areas had rates of high-speed Internet use above the national average by at least 5 percentage points. Of these metropolitan areas, 25 were located in the West, 17 in the Midwest, and 13 in the Northeast. Only 4 metropolitan areas in the South had high-speed Internet rates at least 5 percentage points above the national average (Figure 6).
Download full version (PDF): Computer and Internet Use in the United States
About the U.S. Census Bureau
www.census.gov
The Census Bureau’s mission is to serve as the leading source of quality data about the nation’s people and economy. We honor privacy, protect confidentiality, share our expertise globally, and conduct our work openly. We are guided on this mission by scientific objectivity, our strong and capable workforce, our devotion to research-based innovation, and our abiding commitment to our customers.
Tags: American Community Survey Reports, Internet, United States Census Bureau
 RSS Feed