


NEXT 10
The Carbon Economy
Why is it Important?
The global economy has traditionally been inextricably tethered to carbon-based energy sources. In the U.S., however, emissions data indicate a continuous shift away from carbon-based energy sources. In 2016, energy-related carbon dioxide emissions in the U.S. were 12.5 percent below their 2006 levels, despite continued economic growth. The nationwide drop, which has persisted since the middle of the last decade, was due in large part to the electric power sector shifting away from coal and toward less carbon-intensive fuels.
Despite moves from the current federal administration to roll back policies that manage carbon-intensive energy sources, California continues to lead in implementing statewide policies that incentivize innovation in business, technology and carbon reduction. While California provides a strong template for others to follow in sustaining economic growth while pursuing climate change mitigation policies, there is still work to be done to ensure the state meets its emission reduction goals. Indicators relating to the carbon economy help track this progress and illustrate the changing relationship between economic vitality and environmental quality.
Carbon Economy Indicators
California ranks among the most efficient and least carbon-intensive economies in the world. The state’s portfolio of climate policies, backstopped by its cap-and-trade program, has proven to be successful in reducing emissions, putting the state on track to meet its Assembly Bill 32 (AB 32) goal of reducing emissions to 1990 levels by 2020. The passage of AB 398 in July 2017, extending the state’s cap-and-trade program to 2030, will help drive further emissions reductions required under SB 32, which seeks to reduce GHG emissions to 40 percent below 1990 levels by 2030. Between 1990 and 2014, California’s emissions per dollar of gross domestic product (GDP) dropped by 40 percent, meaning that for the same amount of economic activity, the economy released significantly fewer emissions.
This continued trend demonstrates the state’s success in decoupling emissions from economic growth.
California is relying less and less on carbon-based energy sources. In 2014 (the most recent year for which U.S. carbon emissions data is available), the state was the fourth least carbon-dependent in the U.S. behind only New York, Connecticut and Massachusetts (see Table 1).3 That year, $10,000 of economic activity in the U.S. excluding California) resulted in 3.35 metric tons of CO2 equivalent (MTCO2e). By comparison, $10,000 of economic activity in California resulted in only 1.85 MTCO2e — roughly 55 percent less than the rest of the nation. Compared to the previous year, California’s carbon-dependency improved by 3.7 percent while the U.S. (excluding California) improved by only 0.9 percent. California’s economy was less carbon-dependent than the national average, as well as other large states.
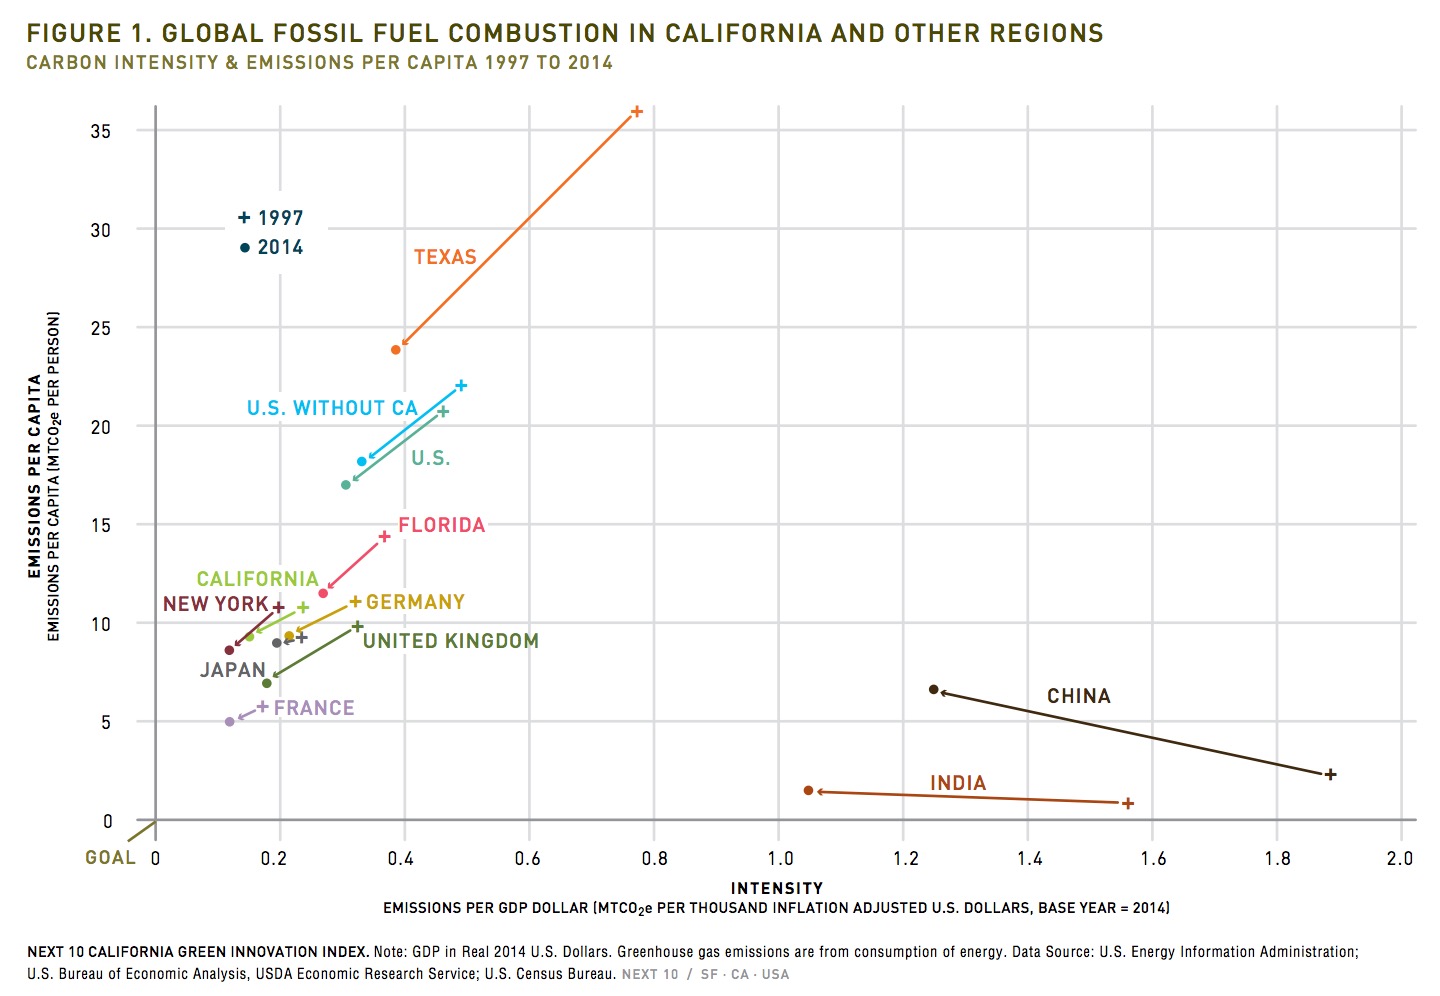
When compared to countries, California performs relatively well in terms of carbon intensity (emissions per dollar of GDP, see Figure 1). California’s emissions per dollar of GDP dropped 35 percent between 1997 and 2014, which was a greater improvement in carbon intensity compared to the U.S. as a whole (-32%), China (-34%), and Germany (-33%). Over the same period, California’s carbon efficiency (emissions per capita) also improved, with per capita emissions decreasing 15 percent. By comparison, the U.S. as a whole decreased per capita emissions 17 percent and China’s carbon efficiency rose 182 percent due to significant increases in standards of living. Texas continued to have one of the highest levels of total emissions in the U.S., but it saw a 50 percent decrease in carbon intensity and 34 percent decrease in per capita emissions from 1997 levels. In 2014, developed nations continued to trend towards a carbon-free economy while per-capita emissions rose in carbon-intensive developing economies such as China and India.
The sources of California’s emissions from energy consumption were comprised of 63 percent petroleum use, 36 percent natural gas and one percent coal in 2014. The lack of coal use in California is in stark contrast to other large states where coal continues to contribute a sizable percentage of carbon emissions, such as Ohio (43%), Pennsylvania (40%), Illinois (41%), and Texas (23%).4 States where coal makes up a higher share of carbon emissions also tend to have higher total energy consumed per capita.5 Meanwhile, in 2014, 63 percent of energy-related emissions in California were a result of extracting, refining, and burning petroleum, compared to 48 percent in Florida, 43 percent in Texas, and 34 percent in Illinois — states that also host large populations and diverse economies.
Greenhouse gas emissions per capita in California decreased 1.1 percent in 2015 compared to 2014, with overall emissions decreasing while population increased slightly, reaching 11.3 MTCO2e per person in 2015. Greenhouse gas emissions per capita dropped 22 percent since 1990 (Figure 3). This long-term efficiency improvement has been achieved while the economy has continued to grow, as evidenced by a 34 percent jump in GDP per capita since 1990 and 3.5 percent increase since 2014.
There continues to be a steady decline in the carbon intensity (emissions per GDP) of the California economy, with emissions of 1.77 MTCO2e per $10,000 of GDP generated in 2015. This marks a 4.5 percent improvement from 2014 and a 14.5 percent improvement since 2010.
Total GHG emissions in California fell slightly in 2015 compared to 2014, down 0.34 percent to 440.36 million MTCO2e — despite a 2.7 percent increase in emissions from the transportation sector, which accounts for the largest share of the state’s GHG emissions.6 Persistent drought conditions from 2011 to 2016 precipitated the continued decline of hydroelectric power generation in the state, down 18 percent in 2015 compared to 2014 and 60 percent compared to 2011. Hydropower provides an emissions-free energy source for Californians, but when there is a low availability of hydroelectric power, electricity from natural gas replaces it.
California’s dependency on electricity from natural gas — a fossil fuel — is also trending down. Compared to 2014, in-state generation and total consumption of electricity generated from natural gas were down 3.6 percent and 1.8 percent, respectively, in 2015. Furthermore, the U.S. Energy Information Administration estimates that as of April 2017, with the drought now ended, increased hydroelectric generation and solar power generation have contributed to a recent decrease in natural gas-fired power generation.
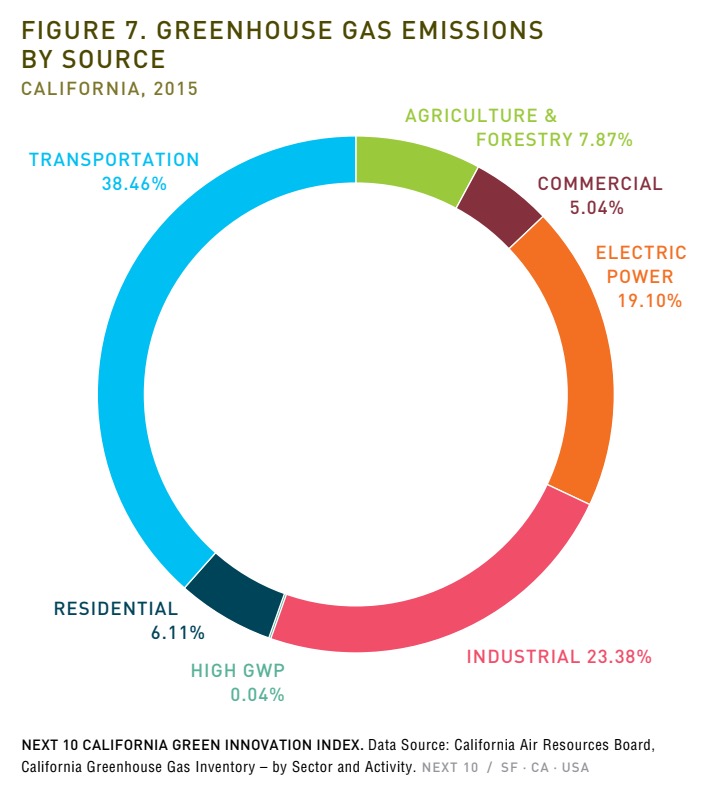 The transportation sector continued to account for the largest portion (38.5%) of California’s GHG emissions, followed by the industrial (23.4%) and electric power sectors (19.1%). The California Air Resources Board collects GHG emissions data by direct source of emissions rather than by end-user.
Transportation (38.5%): Emissions from all transportation sources accounted for 38.5 percent of California’s total emissions, up from 37.3 percent of the total in 2014. About 69 percent of transportation emissions came from on-road passenger vehicles and 19 percent from on-road heavy-duty trucks. Other sources, including ships and boats, locomotives, off-road vehicles, and domestic (intrastate) aviation, accounted for the remaining 12 percent of total transportation emissions.
Industrial (23.4%): Industrial activities contributed roughly 23.4 percent of California’s emissions in 2015, up 0.3 percent of the total from 2014. Of these emissions, 27 percent came from petroleum refining, with oil and gas extraction (19%) and industrial manufacturing (17%) representing the next largest sources. Other emissions from industrial sources included cogeneration (9%), landfills (8%), cement plants (7%), and wastewater and solid waste treatment (2%).
Electric Power (19.1%): Greenhouse gas emissions related to electricity generation contributed almost 20 percent to California’s total emissions in 2015, down 0.9 percent from 2014. Of these emissions, in-state electric power generation (including from natural gas and other fuels) accounted for 60 percent, while 40 percent was derived from electric power imports.
Agriculture and Forestry (7.9%): Emissions from agriculture and forestry represented roughly eight percent of California’s total emissions in 2015, down 0.3 percent from 2014. Livestock operations accounted for 66 percent of total agriculture and forestry emissions. Crop growth and harvesting accounted for 22 percent of emissions, while the remainder (12%) came from other sources such as soil cultivation and agricultural residue burning.
Residential (6.1%): The residential sector comprised 6.1 percent of total emissions in the state in 2015, up 0.2 percent compared to 2014. Residential sector emissions are largely from combustion of natural gas and other fuels to heat houses and buildings, prepare food, and heat water. The increase may be partially attributed to the emissions associated with the replacement of ozone-depleting substances (namely hydrofluorocarbon-based pollutants used in refrigeration and air conditioning) with substitutes and the record heat wave in 2015 that caused many Californians to use air conditioning more than usual.
Commercial (5.0%): Emissions from commercial fuel combustion and cogeneration heat output accounted for five percent of emissions statewide in 2015, up 0.2 percent compared to 2014. The vast majority of these emissions were from combustion of natural gas and other fuels for uses such as heating buildings and usage of substitutes for ozone-depleting substances. While usage of substitutes for ozone-depleting substances make up a small share of total GHG emissions, its associated GHG emissions went up 257 percent compared to 2005, growing considerably faster than GHG emissions from other subsector activities.
High Global Warming Potentials (GWP) (0.04%): High GWP not incorporated into other categories, as well as unclassified fugitive greenhouse gas emissions, made up well below one quarter of one percent of California’s total in 2015. These emissions came largely from evaporative losses of chemicals and solvents.
Download full version (PDF): California Green Innovation Index
About Next 10
www.next10.org
Next 10 is focused on innovation and the intersection between the economy, the environment, and quality of life issues for all Californians. We create tools and provide information that fosters a deeper understanding of the critical issues affecting all Californians. Through education and civic engagement, we hope Californians will become empowered to affect change.
Tags: CA, California, Emissions, GHG, Greenhouse Gas, Next 10
 RSS Feed