


CERES
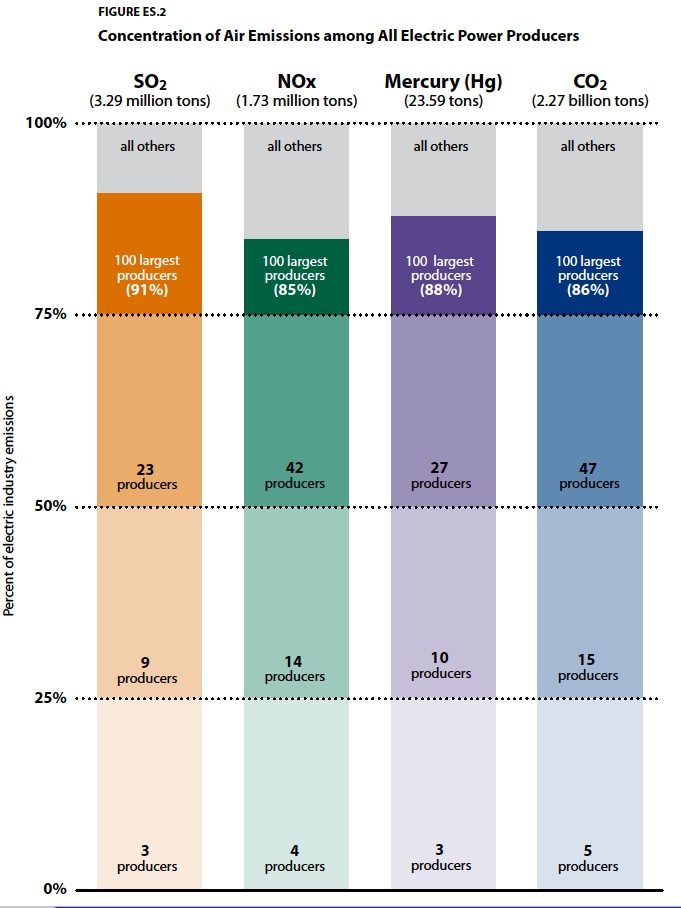
This report examines and compares the stack air pollutant emissions of the 100 largest power producers in the United States based on their 2012 generation, plant ownership, and emissions data. Table ES.1 lists the 100 largest power producers featured in this report ranked by their total electricity generation from fossil fuel, nuclear, and renewable energy facilities. These producers include public and private entities1 (collectively referred to as “companies” or “producers” in this report) that own more than 2,700 power plants and account for 86 percent of reported electric generation and 87 percent of the industry’s reported emissions.
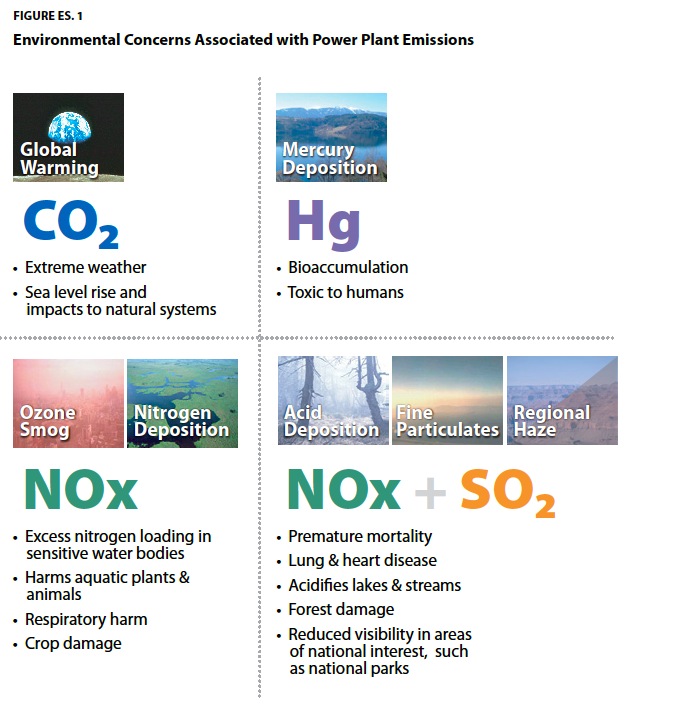
The report focuses on four power plant pollutants for which public emissions data are available: sulfur dioxide (SO2), oxides of nitrogen (NOx), mercury (Hg), and carbon dioxide (CO2). These pollutants are associated with significant environmental and public health problems, including acid deposition, global warming, fine particle air pollution, mercury deposition, nitrogen deposition, ozone smog, and regional haze. The report benchmarks, or ranks, each company’s absolute emissions and its emission rate (determined by dividing emissions by electricity produced) for each pollutant against the emissions of the other companies. Appendix A discusses the data sources and methodology used to benchmark the 100 largest power producers.
Major Findings
Industry Trends
The electric power industry is in a period of transition. In particular, electricity demand growth has been relatively flat and natural gas prices have remained at low levels, leading to increased natural gas use within the electric sector. Companies are retiring aging power plants, including roughly 18 percent of the nation’s coal-fired generating fleet and more than 4 gigawatts of nuclear capacity. Renewable energy capacity continues to expand with record growth in wind and solar energy.
Since January 2010, plant owners have announced about 60,000 megawatts of coal plant retirements. This represents roughly 18 percent of the nation’s coal-fired generating fleet. About 16,000 megawatts of this capacity has already been shut down, and another 34,000 megawatts is scheduled to do so by yearend 2016. Also, coal plant utilization has declined in recent years; the average annual capacity factor of coal plants in the U.S. dropped from 73 percent in 2008 to 60 percent in 2013.
Since declining to their lowest levels in 10 years in 2012, natural gas prices experienced a modest increase in 2013. Despite this modest increase, natural gas prices have remained relatively low by historic standards and total natural gas consumption in the U.S. reached a record high of over 26 trillion cubic feet in 2013. Natural gas consumption by the electric sector has increased by nearly 60 percent over the past 10 years. Natural gas combined-cycle power plants have been running more often in recent years; average capacity factors have increased from 40 to 47 percent between 2008 and 2013.
In 2012 and 2013, four nuclear power plants announced plans to retire and five major updates were canceled. In some cases, plant-specific equipment issues have led to early retirement decisions. However, other factors have also been putting significant financial pressures on nuclear plants operating in competitive power markets and these pressures have increased in recent years. Further nuclear plant closures could lead to further CO2 emissions increases; however, depending on the stringency, some portion of these emission increases could be mitigated by an effective national policy to limit CO2 emissions.
Renewable energy and energy efficiency have shown increased growth and investment. Although total electricity generation has decreased modestly since 2010, renewable electricity generation (excluding large hydroelectric projects) has increased by over 50 million megawatt hours between 2010 and 2012, a 31 percent increase. Wind energy remains the largest source of non-hydroelectric renewable energy. In 2012, the U.S. wind energy industry experienced record growth, adding over 13,000 megawatts of new wind power capacity, bringing the nation’s cumulative total to over 60,000 megawatts. U.S. state budgets for electricity and natural gas efficiency and demand response programs have continued to increase modestly, totaling over $8.2 billion in 2012 compared to $8 billion in 2011.
Download full version (PDF): Benchmarking Air Emissions
About Ceres
www.ceres.org
“Ceres (pronounced “series”) is a national network of investors, environmental organizations and other public interest groups working with companies and investors to address sustainability challenges such as global climate change.”
Tags: Ceres
 RSS Feed