


CERES
Emissions of the 100 Largest Electric Power Producers
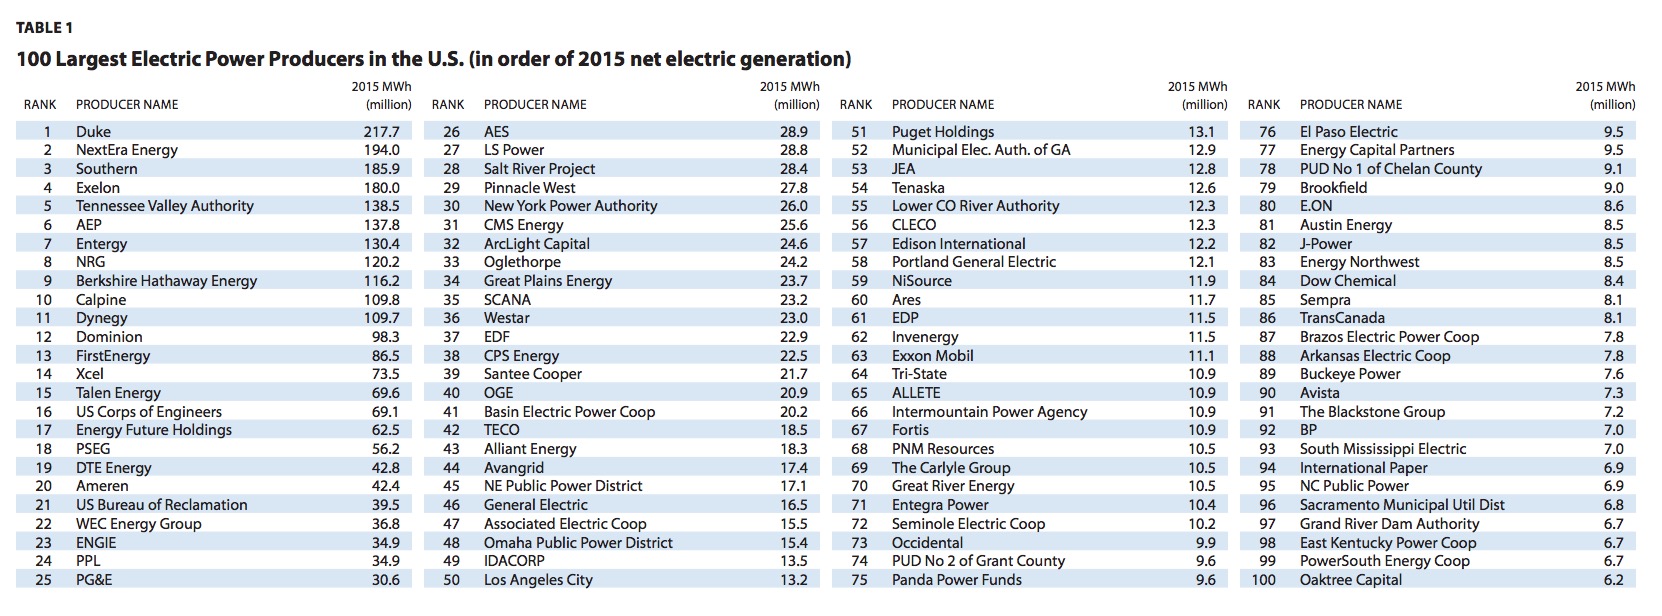
This report examines and compares the stack air pollutant emissions of the 100 largest power producers in the United States based on their 2015 generation, plant ownership, and emissions data. Table 1 lists the 100 largest power producers featured in this report ranked by their total electricity generation from fossil fuel, nuclear, and renewable energy facilities. These producers include public and private entities1 (collectively referred to as “companies” or “producers” in this report) that own roughly 2,900 power plants and account for 85 percent of reported electric generation and 86 percent of the industry’s reported emissions.
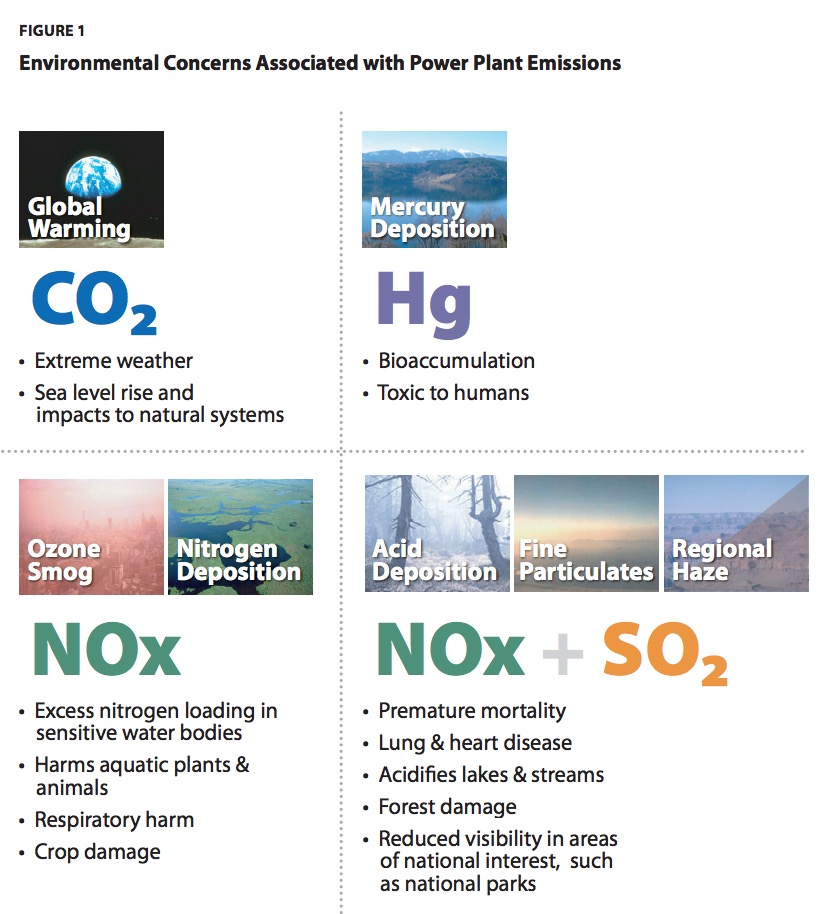
The report focuses on four power plant pollutants for which public emissions data are available: sulfur dioxide (SO2), nitrogen oxides (NOx), mercury (Hg), and carbon dioxide (CO2). At sufficient concentrations, these pollutants are associated with significant environmental and public health problems, including acid deposition, mercury deposition, nitrogen deposition, global warming, ground-level ozone, regional haze, and fine particle air pollution, which can trigger asthma attacks and lead to other respiratory illnesses. The report benchmarks, or ranks, each company’s absolute emissions and its emission rate (determined by dividing emissions by electricity produced) for each pollutant.
The 100 largest power producers emitted in aggregate approximately 1.91 million tons of SO2, 1.17 million tons of NOx, 12.56 tons of mercury, and 1.8 billion tons of CO2. Across the industry, power plant emissions of SO2 and NOx have decreased dramatically, while CO2 emissions are slightly above 1990 levels. CO2 emissions peaked in 2007, and have declined steadily since then. In 2015, power plant SO2 and NOx emissions were 87 percent and 79 percent lower, respectively, than they were in 1990. In 2015, power plant CO2 emissions were 6 percent higher than they were in 1990. However, in recent years, power plant CO2 emissions have declined significantly. In 2015, power plant CO2 emissions were 20 percent below 2005 levels. Emissions rates have also dropped, with 2015 power plant SO2, NOx, and CO2 emissions rates 90 percent, 84 percent, and 21 percent lower, respectively, than they were in 1990. Mercury emissions from power plants have decreased 69 percent since 2000 (the first year that mercury emissions were reported by the industry under the Toxics Release Inventory). The mercury emission rate decreased by 55 percent between 2000 and 2015.
 Collectively, power plants are responsible for a declining share of U.S. air pollution emissions. In 2015, power plants were responsible for about 59 percent of SO2 emissions, 13 percent of NOx emissions, and 38 percent of CO2 emissions. Power plants accounted for 44 percent of mercury emissions in 2014, the most recent year that economy-wide data are available. Figure 2 shows the electric sector’s contribution to total U.S. emissions of SO2, NOx, and CO2 in 2010 and 2015, and mercury in 2011 and 2014. As the electric sector has reduced its emissions, the sector has contributed a declining share of total emissions.
Electric power producers’ emission levels and emission rates vary significantly by company due to the amount of power produced, the efficiency of the technology used in producing the power, the fuel used to generate the power, and installed pollution controls. The average and median emission levels (ton) and emission rates (lb/MWh) shown in Table 2 provide benchmark measures of overall industry emissions that can be used as reference points to evaluate the emissions performance of individual power producers.
Generation by Fuel Type
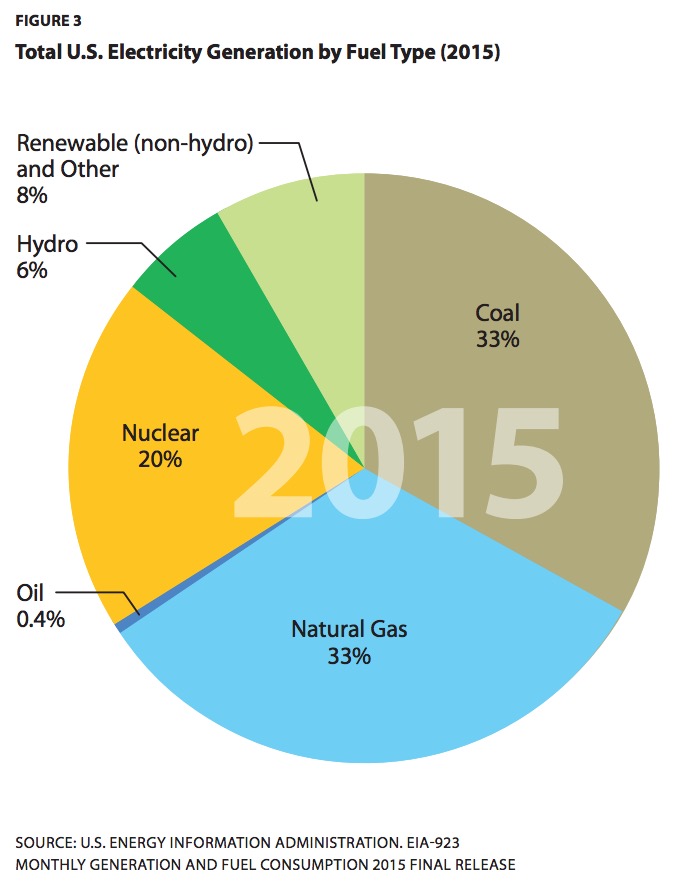 The 100 largest power producers in the U.S. accounted for 85 percent of the electricity produced in 2015. Coal accounted for 34 percent of the power produced by the 100 largest companies, followed by natural gas (32 percent), nuclear (23 percent), hydroelectric power (6 percent), oil (<1 percent), and non-hydroelectric renewables and other fuel sources such as non-biogenic municipal solid waste, tire-derived fuel, manufactured and waste gases, etc. (5 and 1 percent, respectively). This is a dramatic shift from a decade ago (2006), when coal and natural gas accounted for 52 percent and 17 percent of power production, respectively, of the 100 largest producers. In 2006, non-hydroelectric renewables accounted for less than 1 percent of the power produced by the 100 largest power producers. Among smaller companies (i.e., those not within the top 100), natural gas was the source of 37 percent of the power produced, followed by coal (29 percent), non-hydroelectric renewables/other (23 percent), hydroelectric power (6 percent), nuclear power (3 percent), and oil (2 percent).
As a portion of total electric power production, the 100 largest producers accounted for 87 percent of all coal-fired power, 82 percent of natural gas-fired power, 43 percent of oil-fired power, 97 percent of nuclear power, 85 percent of hydroelectric power, and 71 percent of non-hydroelectric renewable power.
Figure 4 presents the in-service year and fuel type of the existing electric generating fleet in the U.S. Figure 5 illustrates the 2015 electricity generation by fuel for each of the 100 largest power producers. The generation levels, expressed in million megawatt hours (MWh), show production from facilities wholly and partially owned by each producer and reported to the EIA. Coal or nuclear accounted for over half of the output of the largest producers. The exceptions are a handful of generating companies whose assets are dominated by hydroelectric or natural gas-fired plants
Table 3 shows the 2015 fuel-mix for each of the 100 largest power producers. The share of each major fuel type—coal, gas, oil, nuclear, hydro, and renewable/other—is shown as a percentage share of total generation from facilities wholly and partially owned by each producer and reported to the EIA.
These data reflect the mix of generating facilities that are directly owned by the 100 largest power producers, not the energy purchases that some utility companies rely on to meet their customers’ electricity needs. For example, some utility companies have signed long-term supply contracts for the output of renewable energy projects. In this report, the output of these facilities would be attributed to the owner of the project, not the buyer of the output.
About Ceres
www.ceres.org
Ceres is a sustainability nonprofit organization working with the most influential investors and companies to build leadership and drive solutions throughout the economy. Through powerful networks and advocacy, Ceres tackles the world’s biggest sustainability challenges, including climate change, water scarcity and pollution, and human rights abuses.
Tags: Ceres, Electricity Generation, Energy Generation, power plants
 RSS Feed