


ADVANCED ENERGY ECONOMY
Global and U.S. Markets by Revenue 2011-2015 and Key Trends in Advanced Energy Growth
Advanced Energy Markets Are Bigger Than Ever
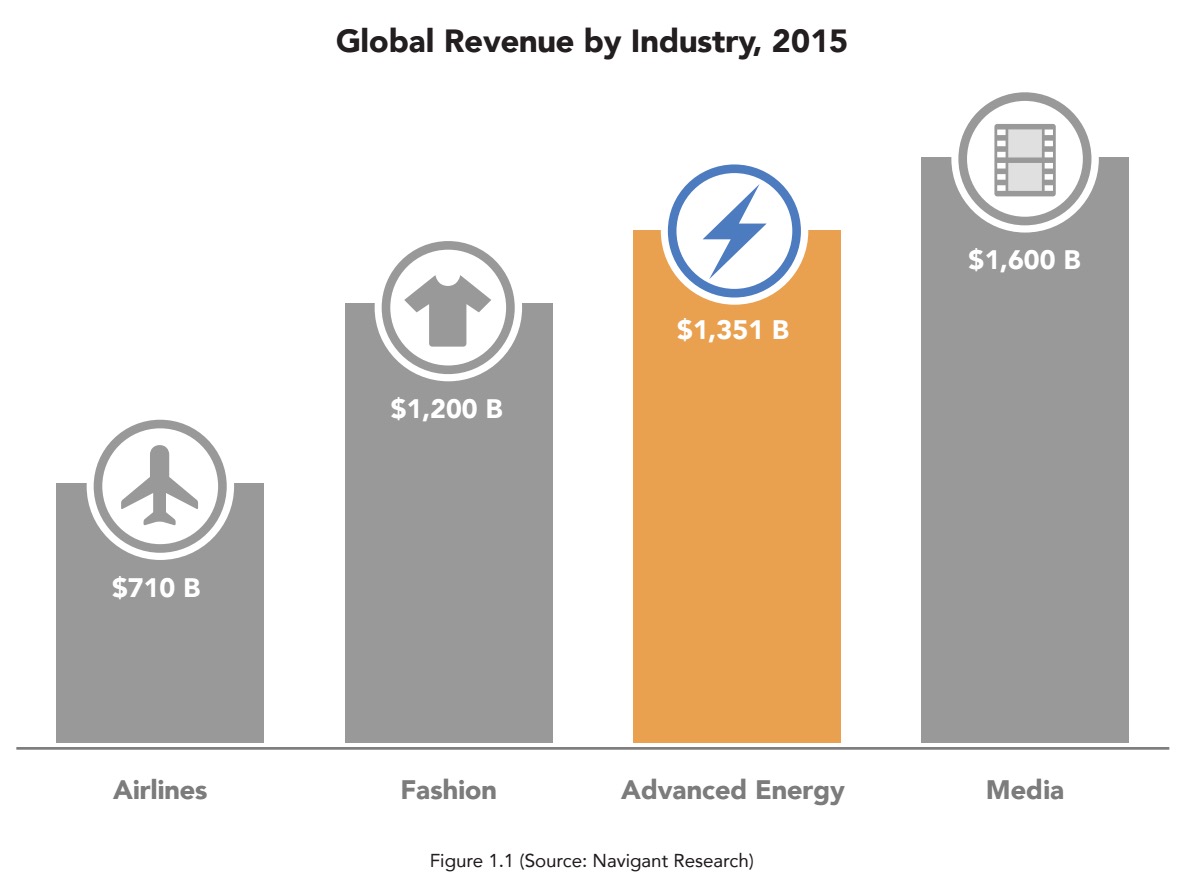
Advanced energy is a $1.4 trillion global industry, as big as fashion, twice the size of airlines, and nearly equal to worldwide spending on media. If global advanced energy were a country, it would be equal to Mexico in GDP.
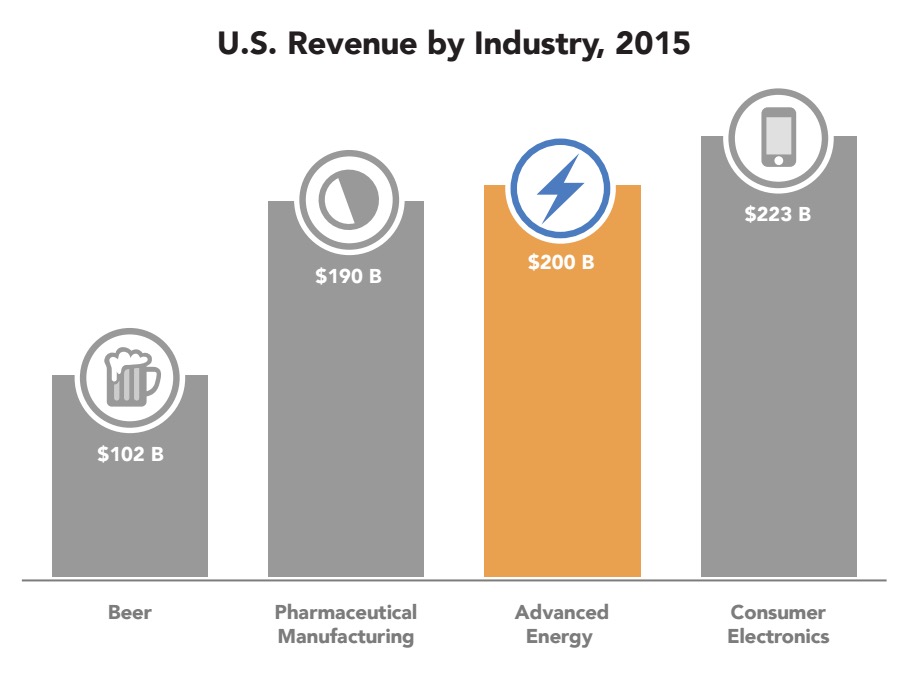
The U.S. advanced energy market is $200 billion, nearly double the revenue from beer sales, more than pharmaceutical manufacturing, and approaching wholesale consumer electronics. If U.S. advanced energy were a state, it would be nearly equal to Oregon in economic activity.
Over the past five years, advanced energy in the United States has grown 29%. Growth over last year was 1%, dampened by the effect of low oil prices on ethanol revenue data. Without Ethanol, U.S. advanced energy revenue grew 10% over last year, four times faster than U.S. GDP.
Advanced Energy Economy’s Advanced Energy Now 2016 Market Report contains five years of revenue, starting with 2011. Highlights from the U.S. market include:
- Building Efficiency is the largest advanced energy market segment, with $63.6 billion in revenue and 50% growth over 2011, counting only products for which we have all five years of data.
- Solar continues to be a dynamic growth story in the U.S. Even as costs have declined by nearly 50%, revenue from Solar PV reached $22.6 billion, up 21% over last year and nearly triple 2011 revenue.
- Wind showed strong growth for the second year in a row, continuing to climb back from a low point in 2013 to reach $14.4 billion in 2015, up 75% over last year.
- At $743 million, revenue from Energy Storage grew 12 times over 2014. This game-changing technology can provide grid support services, meet peak demand needs, and store variable renewable energy generation until it’s needed.
- Ethanol revenue declined by a third over last year. The price of ethanol in the United States tends to follow the price of gasoline. Historically low oil prices brought Ethanol revenue from $40.9 billion in 2014 to $27.3 billion in 2015.
- Revenue from Plug-in Electric Vehicles in 2015 grew seven times over 2011. At nearly $5 billion, revenue from PEVs in 2015 was nearly half that of hybrids, a more established class of advanced vehicle.
Prepared by Navigant Research, Advanced Energy Now 2016 Market Report is the fourth annual report of market size, by revenue, of the advanced energy industry, worldwide and in the United States. As defined by Advanced Energy Economy (AEE), a national business association, advanced energy is a broad range of technologies, products, and services that constitute the best available technologies for meeting energy needs today and tomorrow.
Overview and Summary of Findings
For 2015, the advanced energy market totaled nearly $1.4 trillion in estimated global revenue, up 8% over 2014 and 17% higher than 2011, counting only products for which we have five years of revenue data. The global market for advanced energy in 2015 was twice as big by revenue as the airline industry, bigger than the global fashion industry, and approaching worldwide spending on media and entertainment. (Figure 1.1) From 2014 to 2015, advanced energy revenue grew at more than three times the rate of the world economy overall.
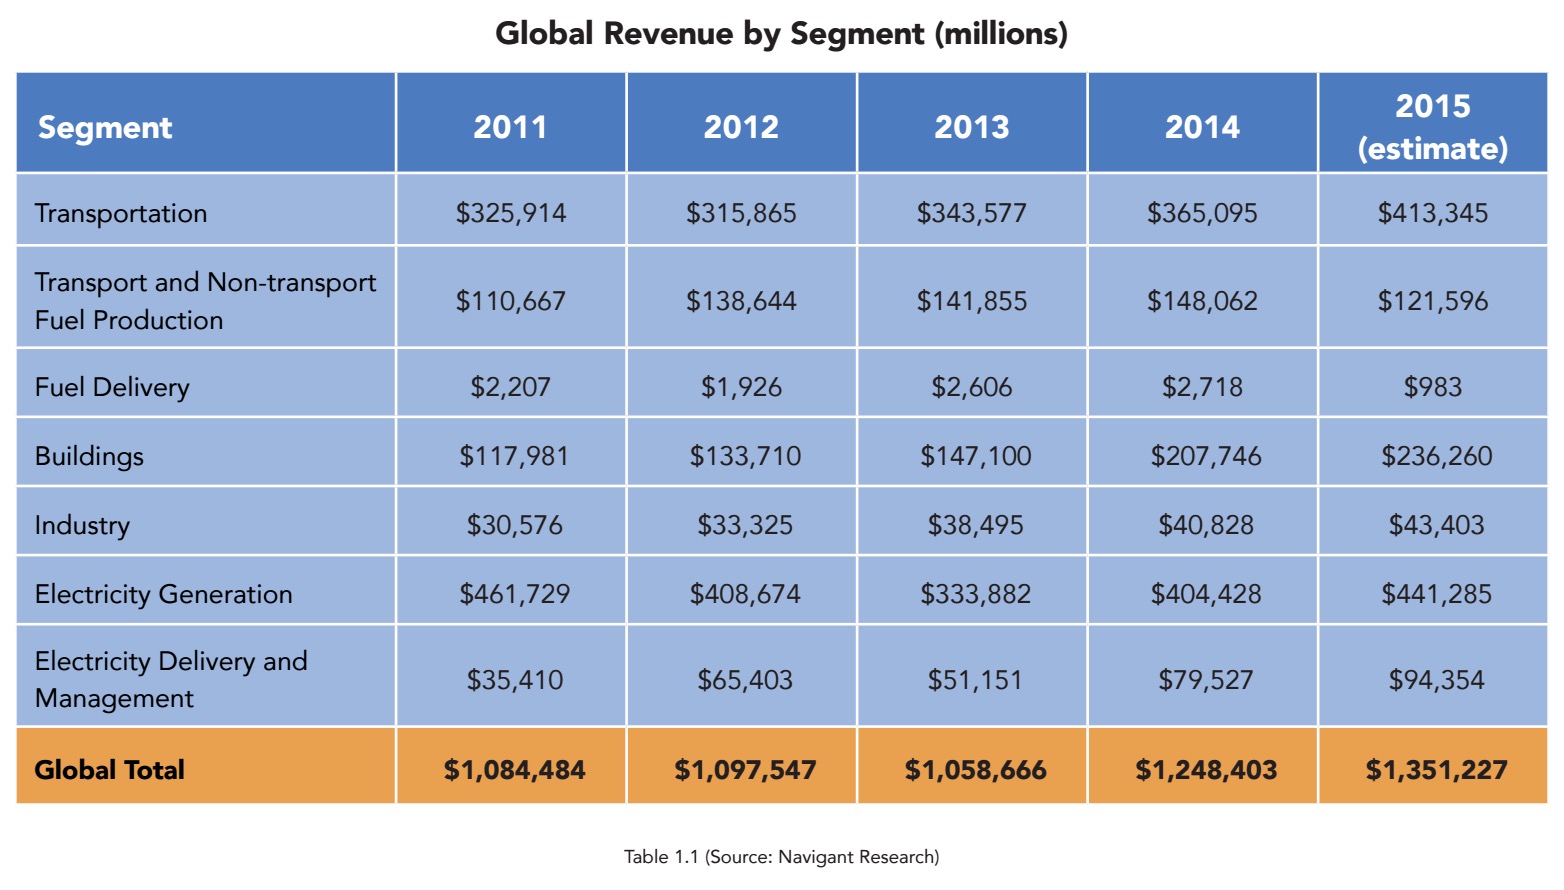
Five of the seven advanced energy segments saw growth over 2014, with only Fuel Delivery (down 64% to $983 million) and Fuel Production (down 18% to $121.6 billion) showing declines. (Table 1.1) For the second year in a row, Electricity Generation remained the largest advanced energy segment with $441.3 billion in revenue (up 9% over 2014), led by growth in Solar, Wind, and Hydropower, followed by Transportation with $413.3 billion (up 13%), led by Clean Diesel Vehicles. The largest year-on-year growth was in Electricity Delivery and Management, growing 19% to $94.4 billion, led by Transmission investments.
In the United States, the advanced energy market reached $199.9 billion in 2015, an increase of 1% over 2014, and up 29% since 2011. The U.S. advanced energy market in 2015 was nearly double the U.S. beer market,5 larger than pharmaceutical manufacturing,6 and close to the wholesale market for consumer electronics.7 (Figure 1.2)
Growth in the U.S. advanced energy market overall was impacted by persistently low oil prices in 2015. Ethanol pricing is highly correlated with oil prices. So, while production increased slightly, from 14.3 to 14.7 billion gallons as the federal Renewable Fuel Standard was fulfilled, ethanol revenue dropped 33%, from $40.9 billion to $27.3 billion.
Without counting ethanol, the U.S. advanced energy market grew 10% in 2015, or four times the growth of U.S. GDP.
Four of the seven U.S. advanced energy segments experienced growth over 2014. (Table 1.2) Accounting for more than 30% of total U.S. advanced energy revenue in 2015, Building Effciency led all segments for the second year in a row, reaching $63.6 billion, up nearly 11% over 2014. Electricity Generation was the second largest advanced energy segment, at $52.3 billion in 2015, and also experienced the second largest year-on-year growth, at 18%, led by Solar, Wind, and Natural Gas Turbines. Following the global trend, Electricity Delivery and Management experienced the largest year-on-year growth, 24%, reaching $18.2 billion in 2015, similarly led by Transmission investments. Reductions were seen in Fuel Delivery (down 31%), Transportation (down 9%, primarily driven by lower sales of Hybrid Vehicles, which were, like ethanol, affected by low gasoline prices), and Fuel Production (down 28%, primarily due to lower prices for ethanol).
Five-Year Trends – Global
Over the past five years, five of the seven advanced energy market segments have seen growth worldwide, counting only products for which we have five years of revenue. Growth has been led by Electricity Delivery and Management (111%), Building Efficiency (60%), Industry (42%), and Transportation (24%). (Figure 1.3)
Within individual segments, significant growth in Transmission (334%), Electric Vehicle Charging Infrastructure (303%), Energy Storage (1,706%), and Enabling Information and Communication Technology (40%) led the Electricity Delivery and Management segment over the five years of tracking. Following the global financial crisis, China, the United States, and countries in Europe and elsewhere invested in transmission and smart grid infrastructure with stimulus funding. These regions have also led the deployment of large-scale generating assets, including the massive deployment of renewables since then, requiring significant investment in smart-grid transmission upgrades, high voltage transmission systems, and submarine transmission systems. As a result, electricity delivery and management investments have begun to build out the grid that will be required to accommodate electricity consumption and production in the 21st century.
Building Efficiency has seen modest but steady annual growth worldwide, becoming a force over the five-year period. Substantial growth has occurred in Building Envelope (100% growth), Appliances and Electronic Equipment (542%), Demand Response and Enabling Information Technology (70%), and Lighting (66%). As the nexus for multiple industries, Navigant Research expects Building Efficiency to continue to be one of the leading sectors of growth, as companies build out the next wave of clean, comfortable, connected buildings.
The 6% market decline in Electricity Generation between 2011 and 2015 is explained by two important trends. First, 2011 was dominated by massive hydroelectric projects in China. Though rebounding from a low of $84.3 billion in 2013, Hydro revenue in 2015 was still $40 billion below the 2011 level of $185.3 – a gap that, by itself, more than accounts for the $20 billion decline in Electricity Generation overall. Second, solar PV has seen a doubling of annual deployment since 2015, but also almost a halving of price – meaning that revenue numbers, while impressive enough (22% growth from 2011 to 2015), understate the remarkable growth of the worldwide solar industry. Wind (54%), Geothermal (155%), and Fuel Cells and Other Distributed Generation (61%) saw increases globally between 2011 and 2015, while declines were marked in Biomass (82%), Nuclear (56%), and Gas Turbines (16%).
With coverage limited to Natural Gas Vehicle Fueling Stations, Commercial Natural Gas Vehicle Fueling Stations (for trucks and other large vehicles), and Hydrogen Fueling Stations, Fuel Delivery is the smallest segment by revenue, and especially subject to annual fluctuations, largely tied to oil prices. In 2011, when oil prices hovered around $100 per barrel, Natural Gas Fueling Stations looked promising – and Fueling Station revenue hit a peak. However, with a 70% drop in oil prices since mid-2014 (to mid-$30 per barrel in early 2016), natural gas fueling stations have become far less attractive, and took an especially sharp fall last year. Additionally, China, as the leading market for natural gas fueling stations, has seen an economic slowdown, further explaining the 55% decline in revenue since 2011.
Download full version (PDF): Advanced Energy Now 2016 Market Report
About Advanced Energy Economy
www.aee.net
Advanced Energy Economy (AEE) is a national association of businesses and business leaders who are making the global energy system more secure, clean and affordable. Advanced energy encompasses a broad range of products and services that constitute the best available technologies for meeting energy needs today and tomorrow. AEE’s mission is to transform public policy to enable rapid growth of advanced energy businesses. AEE and its State Partner organizations are active in 26 states across the country, representing roughly 1,000 companies and organizations in the advanced energy industry.
Tags: Advanced Energy Economy, AEE, Market Report
 RSS Feed