


UNIVERSITY OF MINNESOTA
ACCESIBILITY OBSERVATORY
Executive Summary
 Accessibility is the ease and feasibility of reaching valuable destinations. Accessibility can be measured for a wide array of transportation modes, to different types of destinations, and at different times of day. There are a variety of ways to define accessibility, but the number of destinations reachable within a given travel time is the most comprehensible and transparent—as well as the most directly comparable between cities, and other geographic areas. This report focuses on accessibility to jobs by transit. Jobs are the most significant non-home destination, and job accessibility is an important consideration in the attractiveness and usefulness of a place or area. Transit is used for an estimated 5% of commuting trips in the United States nationwide, making it the second most widely used commute mode after driving.
This study estimates the accessibility to jobs by transit and walking for each of the United States’ 11 million census blocks, and analyzes these data in 49 of the 50 largest (by population) metropolitan areas. Travel times by transit are calculated using detailed pedestrian networks and full transit schedules for the 7:00 – 9:00 AM period. The calculations include all components of a transit journey, including “last mile” access and egress walking segments and transfers, and account for minute-by-minute variations in service frequency.
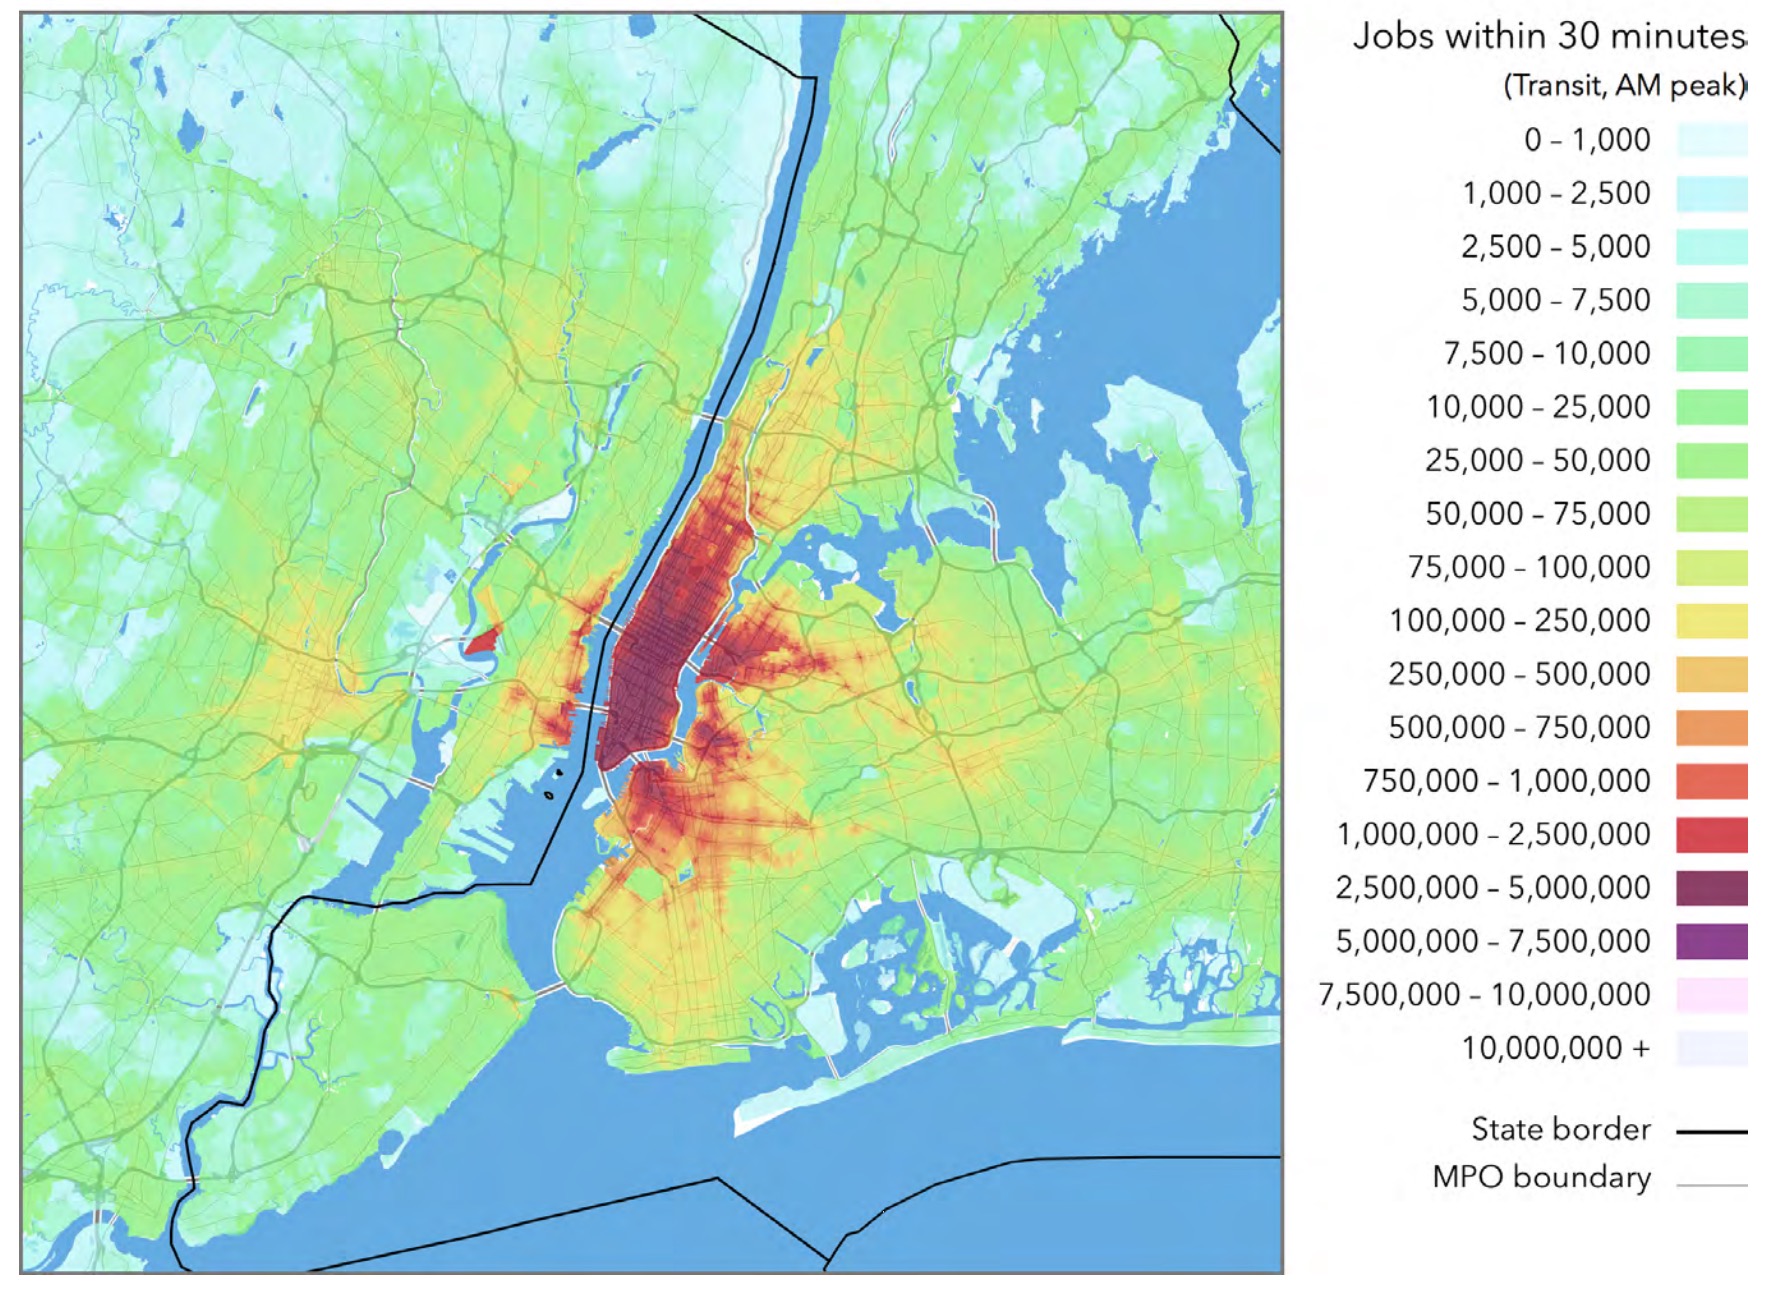
Rankings are determined by a weighted average of accessibility, with a higher weight given to closer, easier to access jobs. Jobs reachable within ten minutes are weighted most heavily, and jobs are given decreasing weights as travel time increases up to 60 minutes. Based on this measure, the 10 metropolitan areas with the greatest accessibility to jobs by transit are:
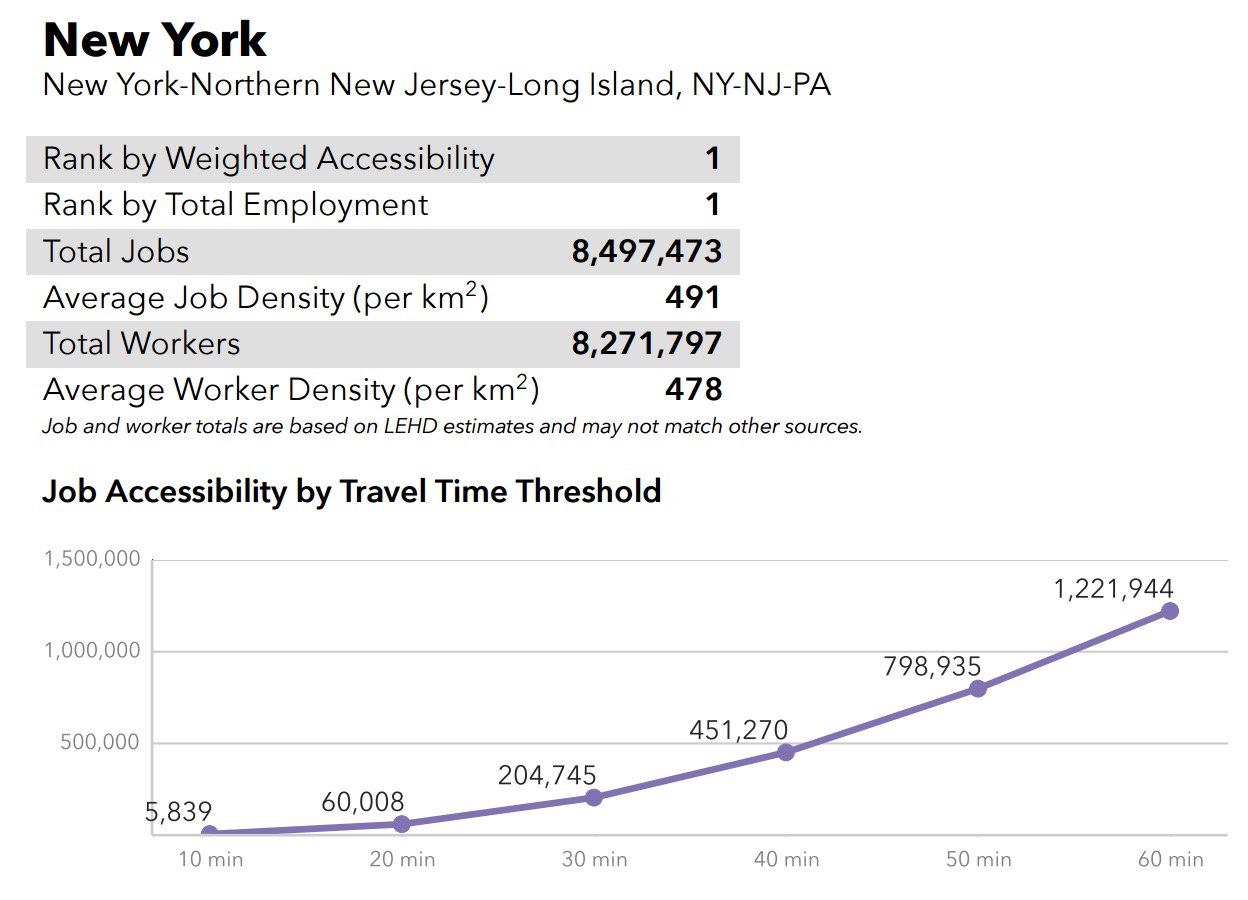
1. New York
2. San Francisco
3. Chicago
4. Washington
5. Los Angeles
6. Boston
7. Philadelphia
8. Seattle
9. San Jose
10. Denver
This report presents detailed accessibility values for each metropolitan area, as well as block-level maps that illustrate the spatial patterns of accessibility within each area, and a U.S. Census tract-level map that shows accessibility patterns at a national scale. A separate publication, Access Across America: Transit 2015 Methodology, describes the data and methodology used in this evaluation.
This analysis uses the same tools and techniques as Access Across America: Transit 2014, with some minor updates to improve accuracy and representativeness of accessibility calculations. However, changes in the availability of transit schedule data from year to year make direct comparisons between the two years’ datasets challenging without much more detailed analysis. For this reason, this report does not directly compare 2014 and 2015 transit accessibility results.
…
Conclusions
The cities that make up the top 10 transit accessibility ranks all exhibit a combination of high density land use and fast, frequent transit service. However, there is still significant variation within this group. In New York, San Francisco, Washington, and Chicago, fast heavy rail systems connect both urban and suburban areas with a highly employment-dense core. It is instructive to compare these cities to Atlanta, which has a similar, but smaller, rail system but a much more decentralized job and population distribution, and lower accessibility. Seattle and Denver both have rapidly expanding light rail systems, supported by extensive and frequent bus networks. Though Portland is famous for its streetcar service, this covers only a small part of the city, and operates mostly in mixed traffic with very little access to proprietary right-of-way, limiting its service speed. Its urban growth boundary, combined with frequent bus service throughout core areas and light rail connections to suburban areas, likely plays a more important role in providing high accessibility: by encouraging both residents and employers to locate in parts of the city already well served by transit, each new resident enjoys high accessibility but imposes only a small marginal burden on the transit system’s existing resources.
Additionally, the expanded scope of this report’s focus toward analyzing accessibility for every census block in the U.S. affords a look at what impact public transit has on a national scale. The map illustrates a few important points. First, it is readily visible that the vast majority of the U.S. land mass is quite sparsely-populated outside of metropolitan areas, and the contained metropolitan areas are in many cases very far apart. Second, the type of transit service included in the analysis is strictly limited to public transit, most commonly found in urban areas—inter-city bus and rail services, such as Megabus, Greyhound, or Jefferson, and Amtrak, respectively, are not included. Further, such services operate on time-scales greater than the travel times involved in this analysis. Given that mostly urban-centric systems are included, only a very small geographical area of the country enjoys mass transit services, and thus the total area experiencing transit accessibility benefits is quite small.
Transportation and land use systems are both dynamic, and this report presents only a single snapshot in time. In constantly-evolving systems like these, it is also critical to monitor changes over time. A city that adopts a goal of increasing transit accessibility should be evaluated based on how effectively it advances that goal relative to a baseline. Access Across America: Transit 2014 served as a starting point in 8 building these time-series data; this report adds 2015 transit accessibility data, and future comparison reports in the Access Across America series will track the way that accessibility in these metropolitan areas evolves in response to transportation investments and land use decisions.
Download full version (PDF): Access Across America 2015
About the University of Minnesota Accessibility Observatory
ao.umn.edu
The Accessibility Observatory at the University of Minnesota is the nation’s leading resource for the research and application of accessibility-based transportation system evaluation. The Observatory is guided by a threefold mission: 1) to advance the field of transportation system evaluation through research of new data sources and methods for accessibility evaluation; 2) to develop standards and tools to facilitate the use and communication of accessibility-based metrics in transportation planning, engineering, and evaluation; 3) to apply our tools and expertise in support of continual improvements in the planning, design, engineering, and analysis of transportation systems.
Tags: Access Across America, Accessibility Observatory, public transit, survey, University of Minnesota
 RSS Feed